Whole Earth Forecaster home
Daily Weather Correlations
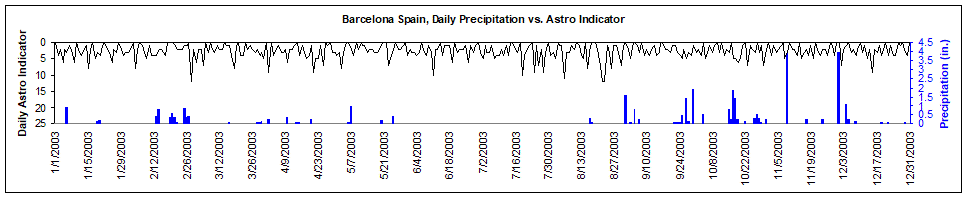
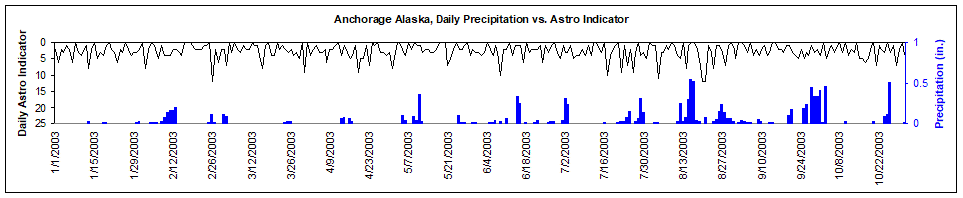
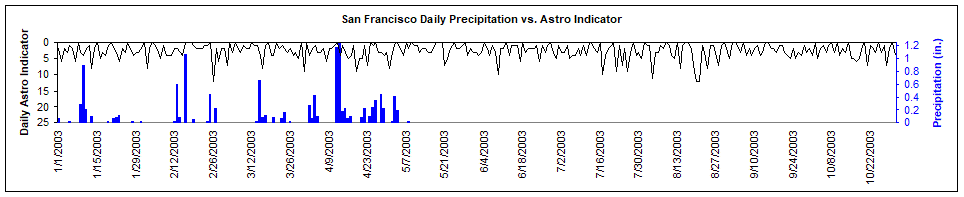
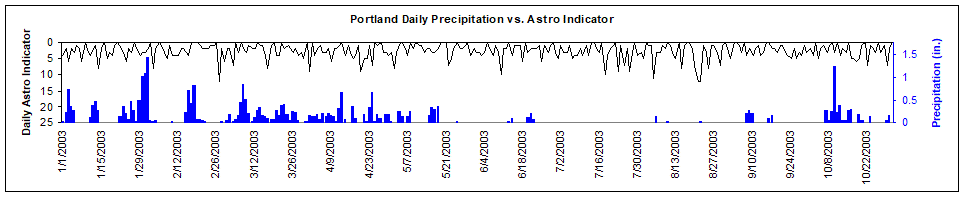
In most correlations there is a lag period of 0-6 days between the actual BT day and the weather effect. BT has been shifted in all charts to account for the lag period for easy viewing. It appears that the west coast of the United States sees little or no lag time. Then as we move east the lag increases with distance. This is due to the time necessary for the weather fronts to move from west to east across the continent.
For all negatively correlated areas the most probable times for precipitation are when BT is bottoming. And, of those bottoming times, the most likely times for precipitation are just prior to and after high BT days. Of course, the opposite is true of positively correlated areas.
Temperature in each area will correlate opposite to the correlation of precipitation. So if the precipitation correlation is negative then temperature will be relatively warm when BT is high and cool when BT is low.
*Note that this is a work in progress. Each location is a piece of the weather motion puzzle. As more data and locations are accumulated, the lag times and correlations will probably be adjusted in order to fit the whole. There are certainly border zones which may fit two correlation modes at times. Those will be discovered as I progress in accumulating data points. The work will proceed from location to location to see where each one fits. By working from one point out it's easier to discover the weather movements and where each location fits. It will be a painstaking undertaking but I believe well worth it. It will be of great benefit to all to ascertain each locations "key" correlation to BT.
Anchorage, AK - negative precipitation/positive temperature correlation, no lag. 
San Francisco, CA - negative precipitation/positive temperature correlation, no lag.
Portland, OR - negative precipitation/positive temperature correlation, 1 day lag.
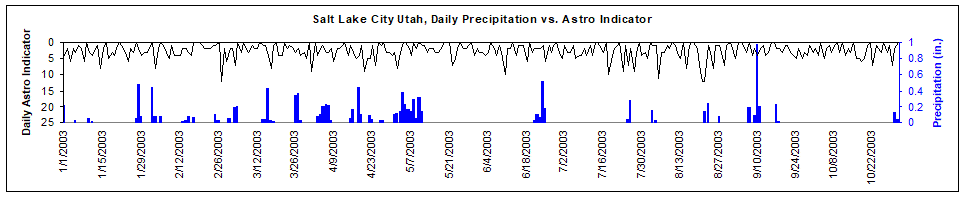
Salt Lake City, UT - negative precipitation/positive temperature correlation, 1 day lag.
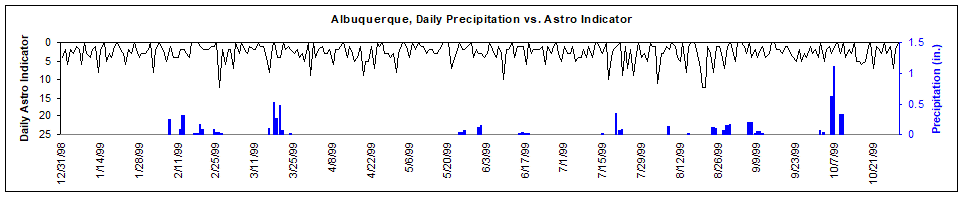
Albuquerque, NM - negative precipitation/positive temperature correlation, 1 day lag.
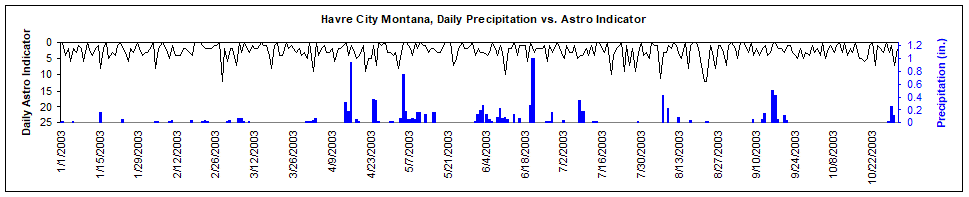
Havre City, MT - negative precipitation/positive temperature correlation, 2 day lag.
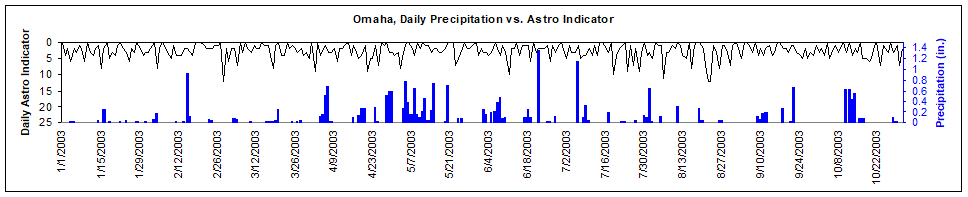
Omaha, NE - negative precipitation/positive temperature correlation, 2 day lag.
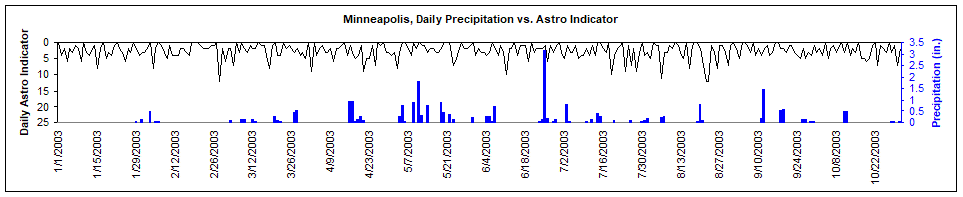
Minneapolis, MN - negative precipitation/positive temperature correlation, 2 day lag.
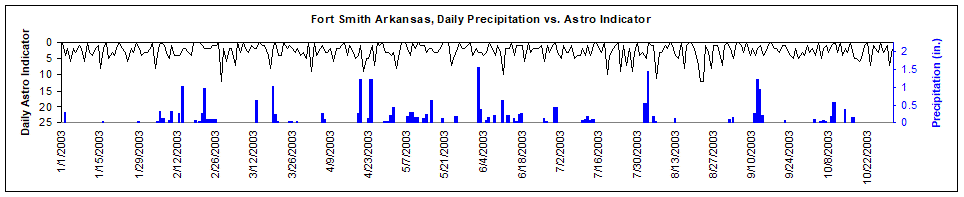
Fort Smith, AR - negative precipitation/positive temperature correlation, 2 day lag.
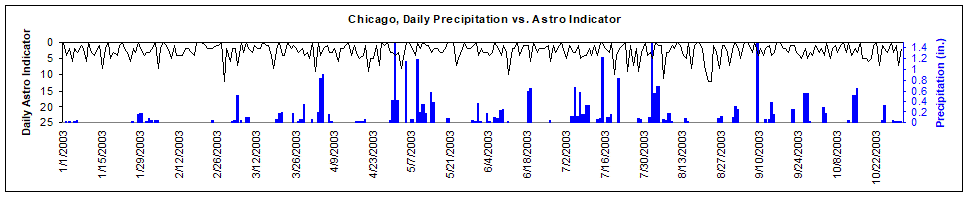
Chicago, IL - negative precipitation/positive temperature correlation, 2 day lag.
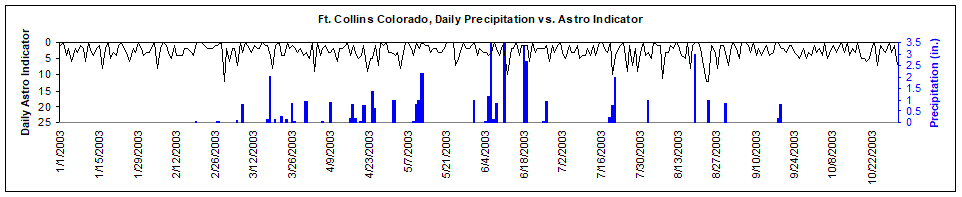
Ft. Collins, CO - negative precipitation/positive temperature correlation, 3 day lag.
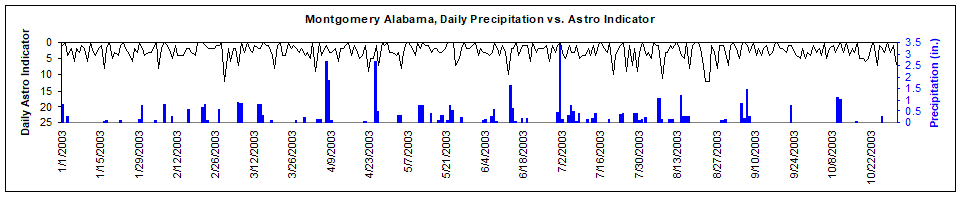
Montgomery, AL - negative precipitation/positive temperature correlation, 3 day lag.
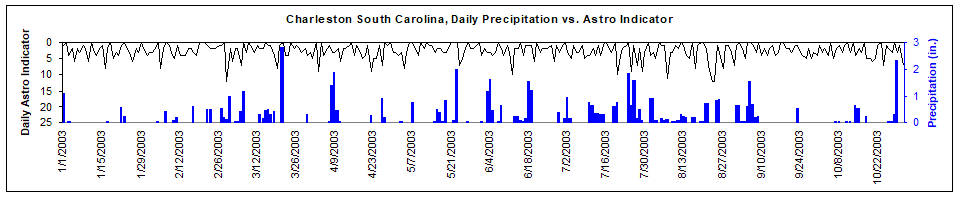
Charleston, SC - negative precipitation/positive temperature correlation, 3 day lag.
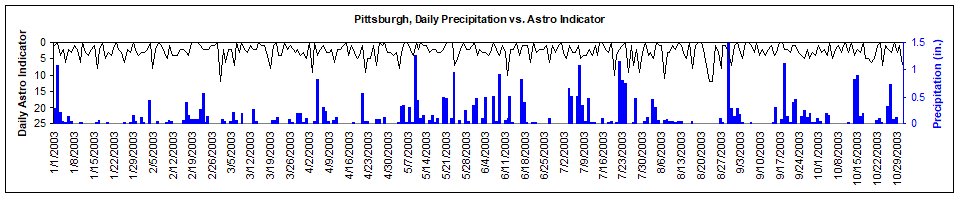
Pittsburgh, PA - negative precipitation/positive temperature correlation, 3 day lag.
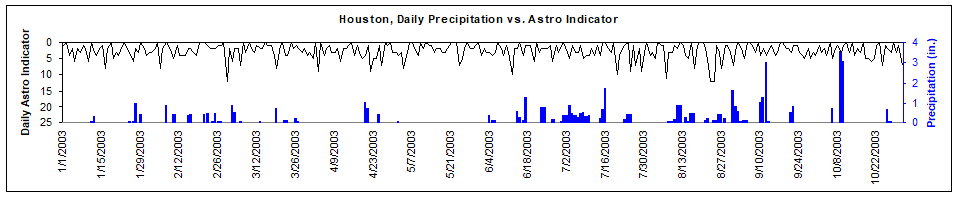
Houston, TX - negative precipitation/positive temperature correlation, 3 day lag.
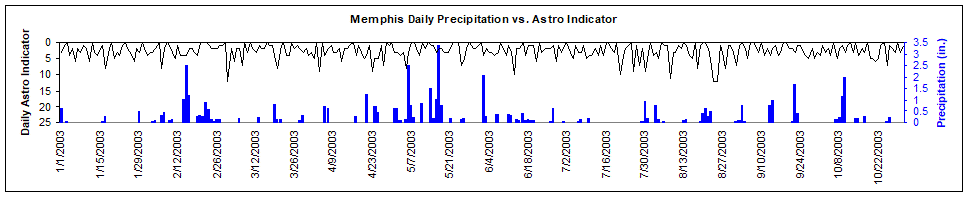
Memphis, TN - negative precipitation/positive temperature correlation, 4 day lag.
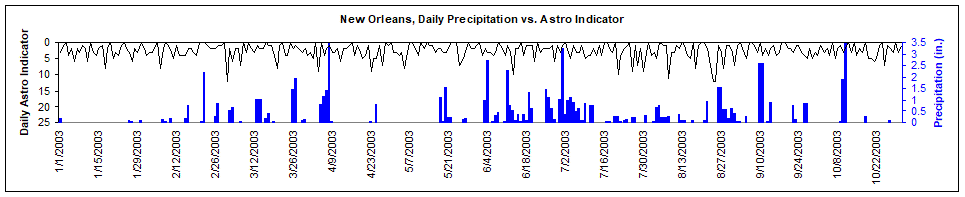
New Orleans, LA - negative precipitation/positive temperature correlation, 4 day lag.
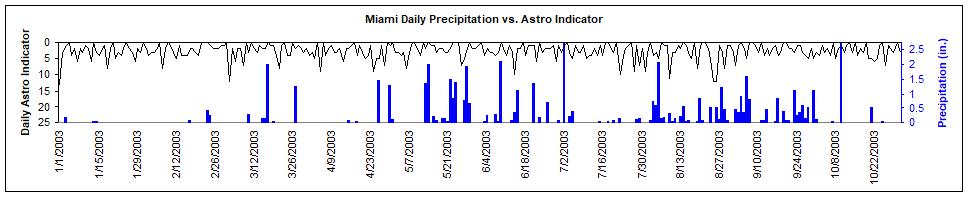
Miami, FL - negative precipitation/positive temperature correlation, 6 day lag.
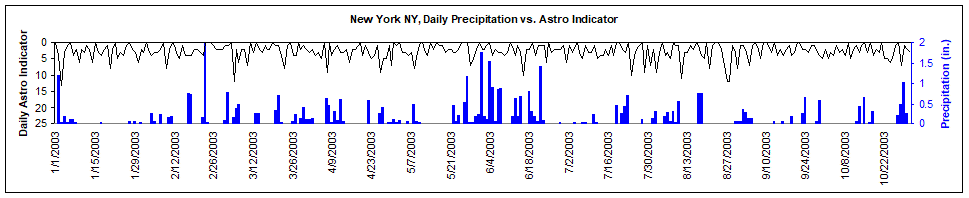
New York, NY - negative precipitation/positive temperature correlation, 6 day lag.
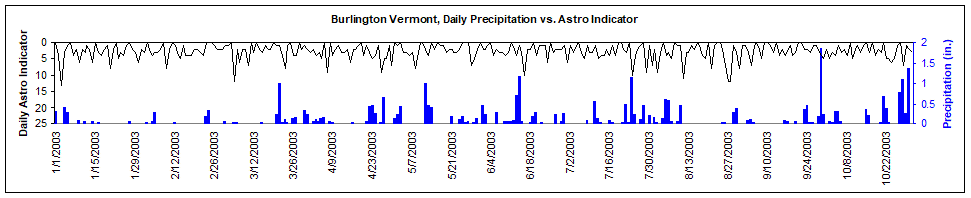
Burlington, VT - negative precipitation/positive temperature correlation, 6 day lag.
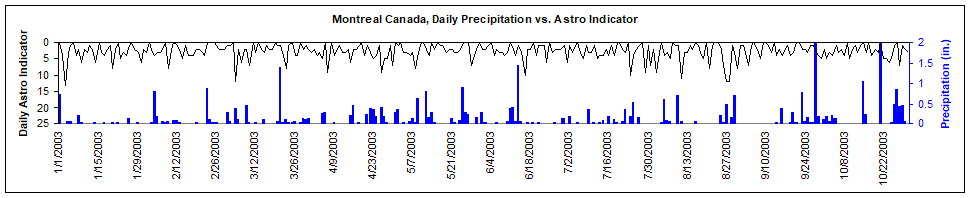
Montreal, CANADA - negative precipitation/positive temperature correlation, 7 day lag.
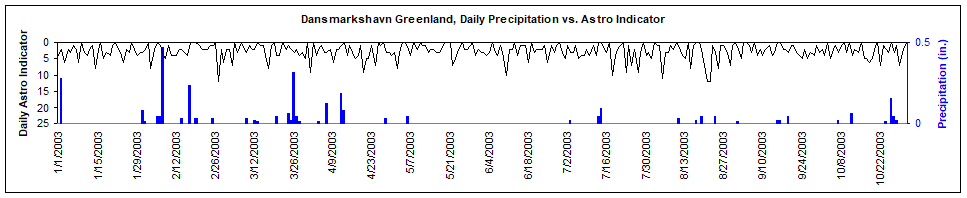
Dansmarkshavn, GREENLAND - negative precipitation/positive temperature correlation, 1 day lag.
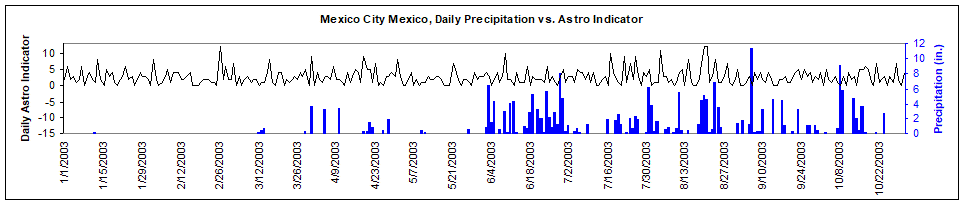
Mexico City, MEXICO - positive precipitation correlation, negative temperature correlation, 0 day lag.
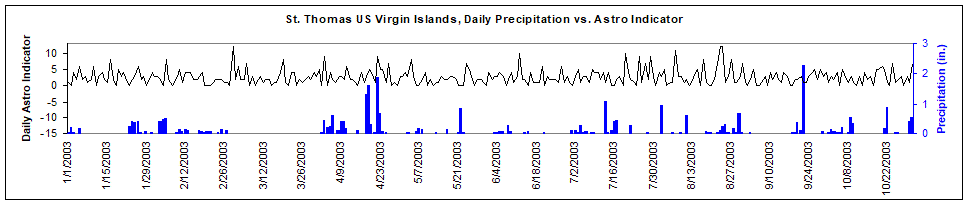
St. Thomas, USVI - positive precipitation correlation, negative temperature correlation, 3 day lag.
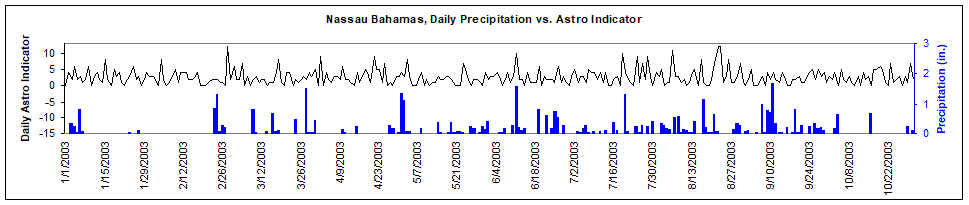
Nassau, BAHAMAS - positive precipitation correlation, negative temperature correlation, 2 day lag.
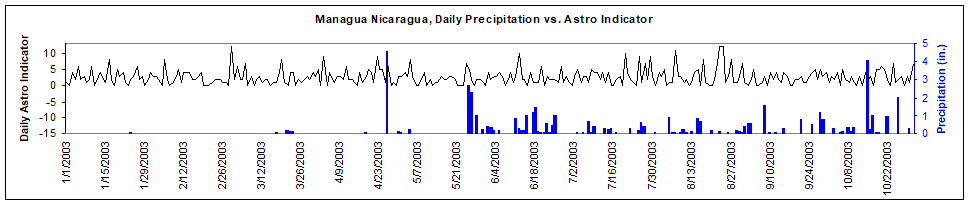
Managua, NICARAGUA - positive precipitation correlation, negative temperature correlation, 3 day lag.
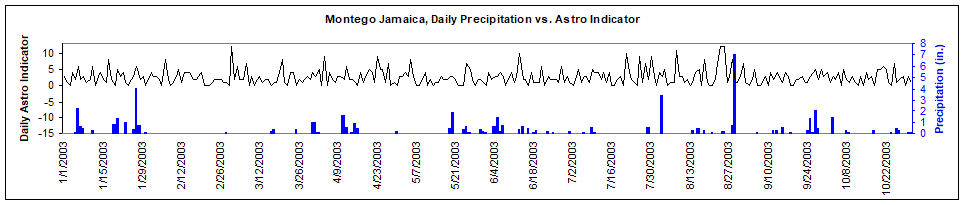
Montego, JAMAICA - positive precipitation correlation, negative temperature correlation, 4 day lag.
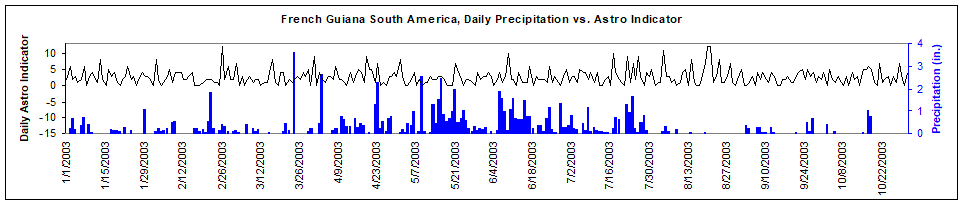
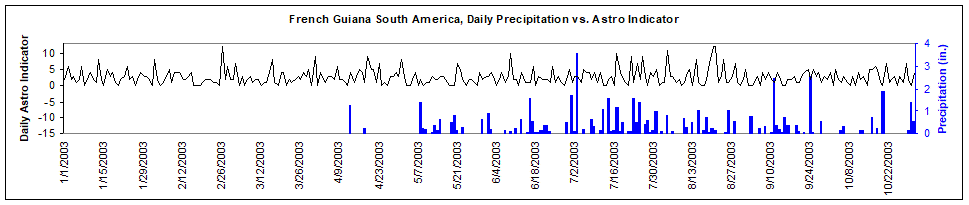
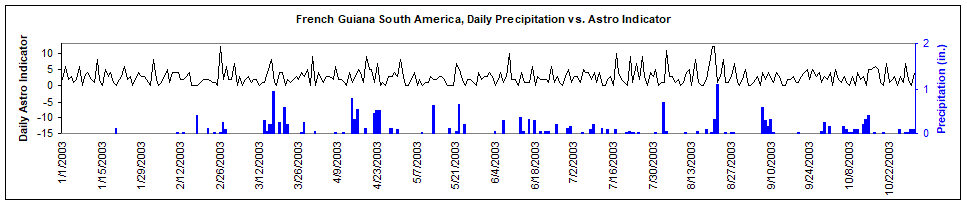
French Guiana, SOUTH AMERICA - positive precipitation correlation, negative temperature correlation, 0 day lag.
San Fernando VENEZUELA - positive precipitation correlation, negative temperature correlation, 0 day lag.
Bogota, COLOMBIA - positive precipitation correlation, negative temperature correlation, 0 day lag.
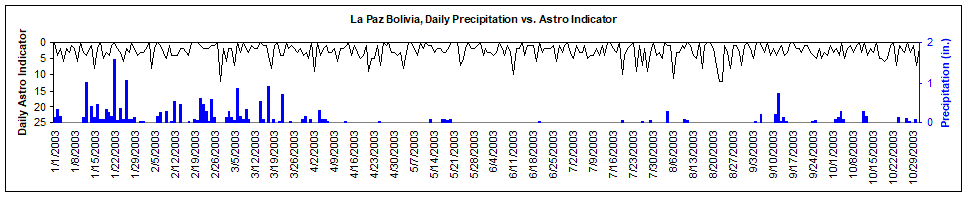
La Paz BOLIVIA - negative precipitation/positive temperature correlation, 2 day lag.
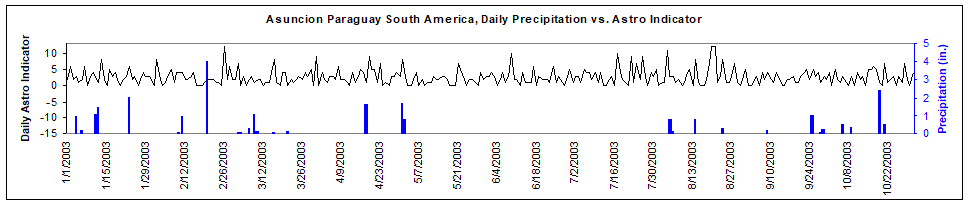
Asuncion PARAGUAY - positive precipitation correlation, negative temperature correlation, 0 day lag.
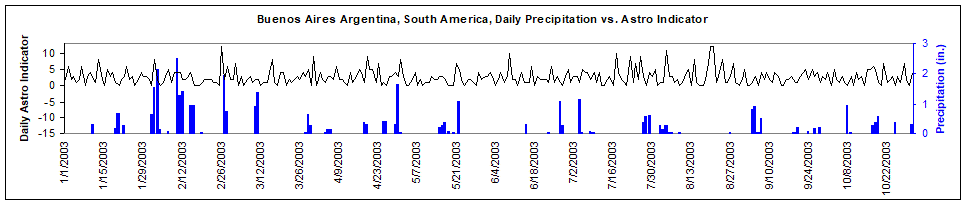
Buenos Aires ARGENTINA - positive precipitation correlation, negative temperature correlation, 0 day lag.
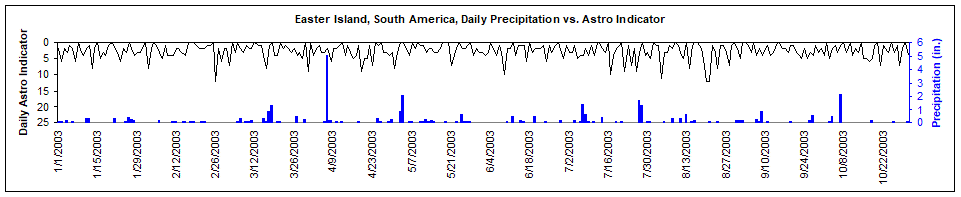
Easter Island CHILE - negative precipitation/positive temperature correlation, 0 day lag.
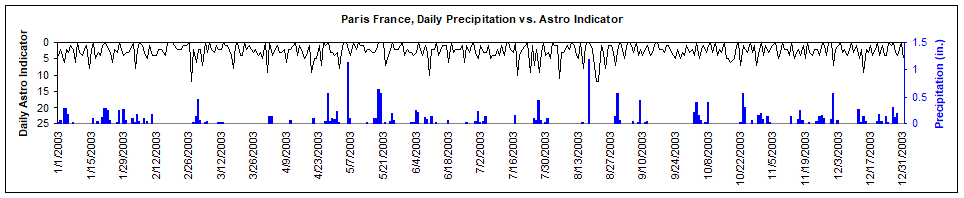
Paris FRANCE - negative precipitation/positive temperature correlation, 1 day lag
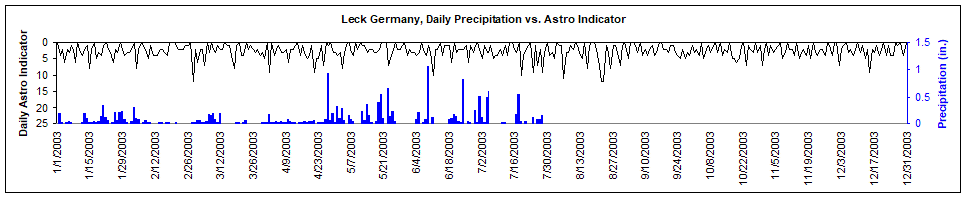
Leck, GERMANY - negative precipitation/positive temperature correlation, 2 day lag
Barcelona, SPAIN - negative precipitation/positive temperature correlation, 2 day lag