Whole Earth Forecaster  | Home
The fellow that can only see a week ahead is always the popular fellow, for he is looking with the crowd.
But the one that can see years ahead, he has a telescope but he can't make anybody believe he has it.
Will Rogers, The Autobiography of Will Rogers, 1949.
All truths are easy to understand once they are discovered; the point is to discover them.
--Galileo
Stock Market --- Intermediate and Long-Term Analysis to 2028
Long-Term Stock Market Forecasting Using the Yearly Berg Timer
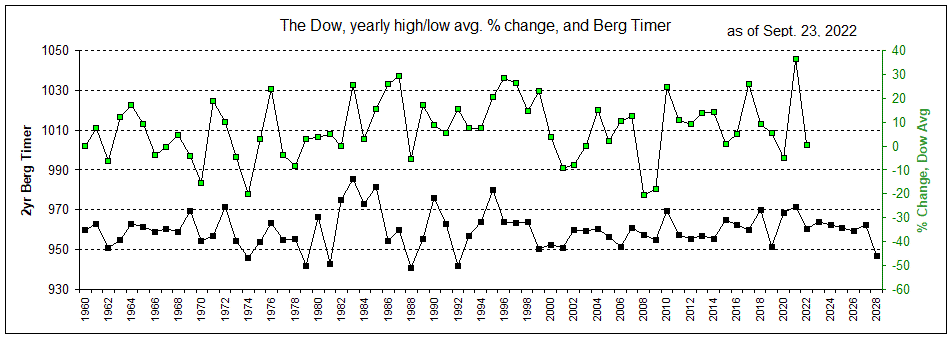
Below are compared the 2-yr moving average of the Berg Timer and yearly Dow, average percent change, since 1960 and forecast to 2028.
The Berg Timer forecast above was first published here in 2002. BT can be calculated infinitely into the future without loss of reliability.
See below for market comments since 2011.
5/7/2021 --- The pandemic threw a wrench into the markets with its Feb-March 2020 collapse. The market's recovery since has redeemed BT with the market at all time highs at the end of 2020. But the yearly average which is monitored by the chart above still showed a small loss. 2021 is forecasted to be a major market high, declining until 2028, thus a major bear market is at our doorstep. Of course, this is caused by changes in atmospherics affecting mass psychology, as represented by the Berg Timer.
10/25/2020 --- The peaceful coalition that Trump has put together in the Middle East is great for the markets, especially after the election picks Trump and the virus is stung by vaccines.
9/15/2020 --- We've survived the pandemic, riots, economic collapse and hurricanes. It remains to be seen whether the stock market will show a net high gain like the chart above forecasts for 2020, of course due to the virus. But the economy could still shoot up at the end of 2020 with the arrival of a vaccine generating great optimism.
3/28/2020 --- Yearly Berg Timer forecast has been extended to 2030, giving us an idea as to how long the decline after 2021 will last. The Coronavirus has put quite a dent in the stock market but it will strongly recover as the virus disappears. 2020 should certainly be up by the end of the year with 2021 being a strong peaking year. So, be a buyer during this virus sell off and a seller in 2021. Expect a major peak in 2021. Then a weak market until 2028. The presidential candidates in 2024 will have to provide the cure for a weak economy. The winner in 2024 will have to give a very good explanation for why he/she should be re-elected in 2028 during a very poor economy. A market peak in 2021 and significant low in 2028.
10/2/2019 --- As forecasted below in 2015 and repeated in 2018, the "retraction" in 2019 has arrived with now some jobs and factory slowdowns and higher inventories. But fear not. Again, as previously stated, "2020 and 2021 look great", as shown in the chart above. Thanks BT!
11/14/2018 --- BT peaks here in 2018 as forecasted infinitely ago by BT (here in 2002). Time now to take some profits. Expect a down 2019 but then a good 2020-21. I have to repeat here what was written in the 2015 piece below, "The next President after Obama will take credit for a strong 2018 but a retraction in 2019 will come. 2020 and 2021 look great, possibly giving the president another term if it happens early enough in 2020." That forecast was so good I must have cheated! But it's not me folks, it's all BT. Yes, Trump taking credit for the 2018 economy. But I wish he would give BT at least some credit.
1/2/2015 --- As forecasted last time in above 2012, economic recovery is now being seen in 2015. However, this is not strong. The above forecast based on the 2-year Berg Timer shows that the economy is displaying a "false" recovery in 2015, with a sluggish economy after that until 2017. The next President after Obama will take credit for a strong 2018 but a retraction in 2019 will come. 2020 and 2021 look great, possibly giving the president another term if it happens early enough in 2020. A slow economy in 2022 to 2025 due to the forecasted major drought during that time.
2012 --- Remember the statement here, published three years ago, stating, "Beware of false optimism in 2010, a double-dip recession is very probable.". The media, finally, talked about a double-dip recession in June 2011, but here, on this website, BT forecasted a double-dip recession three years ago. The decline of the Dow average in 2011/12 was properly forecasted here and can be seen in the chart above.
The economy doesn't recover until 2015, so don't expect sustained market strength until then.
2011 --- Regarding the yearly market strength compared to BT in the chart at the top of the page, You can see how BT forecasted the market doldrums of 1962, 1974, 1988, 2001, 2008 and the hot market periods of 1964, 1972, 1983, 1995, 2004, and 2010. See how it hit the peak in 2010 as forecasted.
BT now declines and stays low for FOUR years.
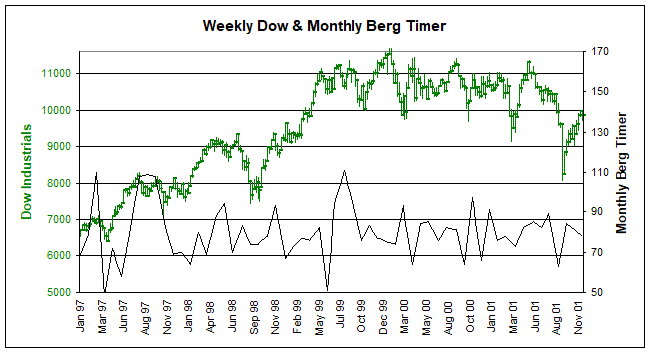
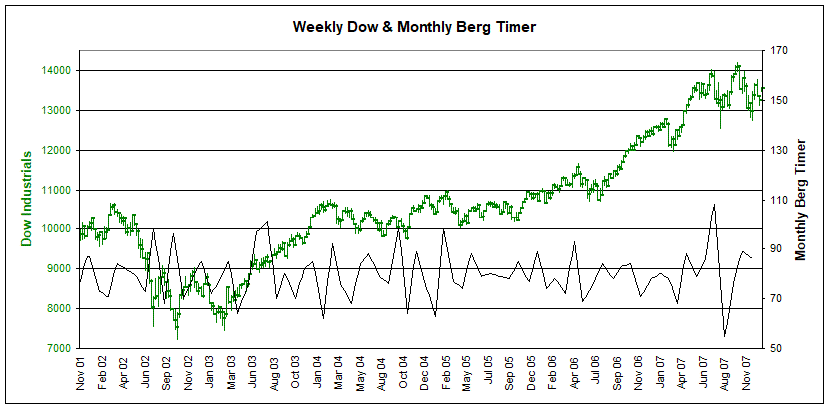
Intermediate-Term Stock Market Forecasting Using the Monthly Berg Timer
Above are compared the weekly Dow Industrials to the Monthly Berg Timer. Strong BT quite consistently marks market peaks and low BT market bottoms.
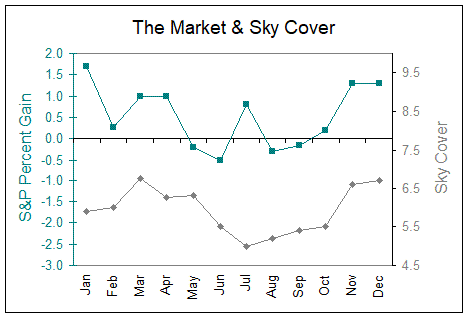
The Market and Sunshine
Below are compared Sky Cover for each month in Omaha from 1970-1991 and the S&P 500 average percent gain/loss each month from 1951 to 1977.
Sky Cover is seasonal and so are stocks.
High Cloudiness = Peaking Market (March, April, November and December).
Low Cloudiness = Bottoming Market (June through October).
"Psychological evidence and casual intuition predict that sunny weather is associated with upbeat mood. This paper examines the relationship between sunny skies and stock returns at 26 stock exchanges internationally from 1982-97. We find that sunshine is highly significantly correlated with daily stock returns."
Good Day Sunshine---Stock Returns and the Weather, David Hirshleifer and Tyler Shumway, August 17, 2001.
"Our analysis reveals that lower temperatures are indeed related to higher stock returns, and higher temperatures to lower stock returns. The relationship is significant both statistically and economically when the temperature is low, and is robust to various alternative tests."
"By examining nine market indices for eight international markets we have indeed uncovered a temperature anomaly. Our analyses reveal a statistically significant relation between the temperature and stock market returns: the lower the temperature, the higher the stock returns, and vice versa.
The relationship is much stronger when the temperature is low. Our results are also robust to alternative definitions of temperature variables and controlling for such known anomalies as the Monday effect, the tax loss effect, the cloud cover effect, and the seasonal affective disorder effect. Thus, our empirical evidence supports the hypothesis regarding lower temperatures vis-`a-vis higher stock returns, and reveals that apathy dominates aggression when the temperature is high, which results in lower stock returns."
Stock Market Returns---A Weather Anomaly, August 2002, Cao & Wei.
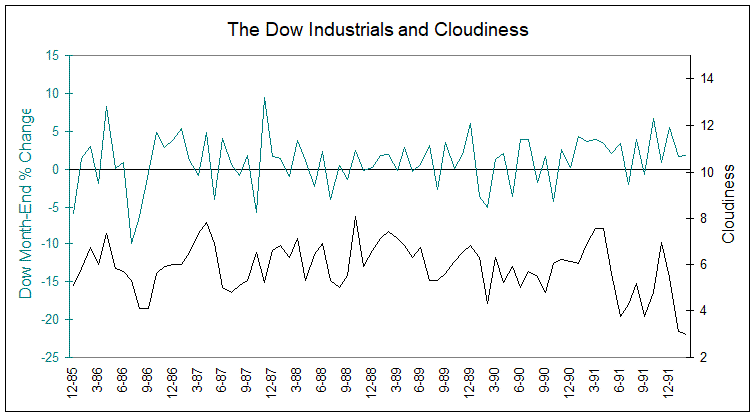
Above I compare the monthly Dow % gain/loss and monthly cloudiness in Omaha from 1990 through 1996. When skies are the most overcast, the market peaks and turns down. When skies are the most sunny, the market bottoms and turns up. Evidently mass psychology, as reflected here in stock market prices, is affected by meteorological and/or atmospheric conditions.
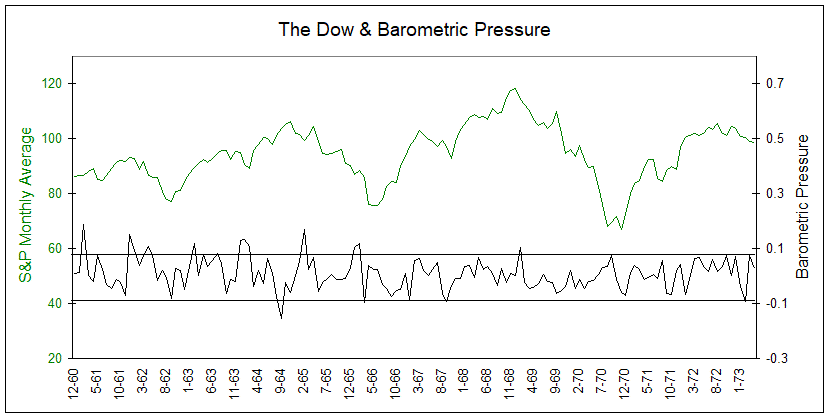
The Market and Barometric Pressure
Below are compared the S&P500 monthly average and barometric pressure, departure-from-normal in Omaha Nebraska.
The stock market makes major peaks and bottoms with barometric pressure peaks and bottoms.
If one had simply bought and sold at the bottom and top lines in pressure, you'd be out at the major top in the Spring 1969, in on the major bottom in mid-1970, out at the major peak in early 1973, and back in at the major bottom in late 1974. Mass psychology, as reflected in stock prices, is apparently affected by meteorological conditions.