Whole Earth Forecaster Home
The Environment
If the observation of the amount of heat the sun sends the earth is among the most important and difficult in astronomical physics, it may also be termed the fundamental problem of meteorology, nearly all whose phenomena would become predictable, if we knew both the original quantity and kind of this heat.
Samuel Pierpont Langley (1834-1906), Report of the Mount Whitney Expedition. Quoted in Abbot, 1958, p 17. Secretary of Smithsonian Institute. Langley's chief scientific interest was the sun and its effect on the weather, and believed that all life and activity on the Earth were made possible by the sun's radiation. In 1878 he invented the bolometer, a radiant-heat detector that is sensitive to temperature of one hundred-thousandth of a degree Celsius.
Solar Activity 
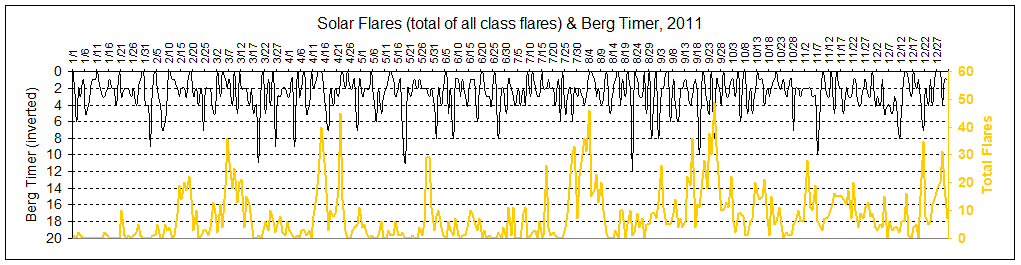
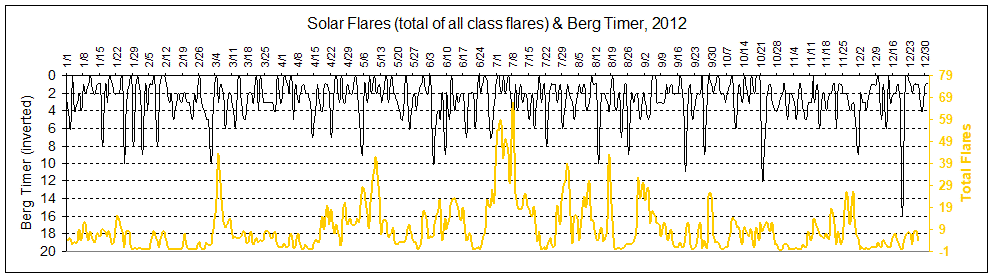
2011-2012 Total Solar Flares and Berg Timer
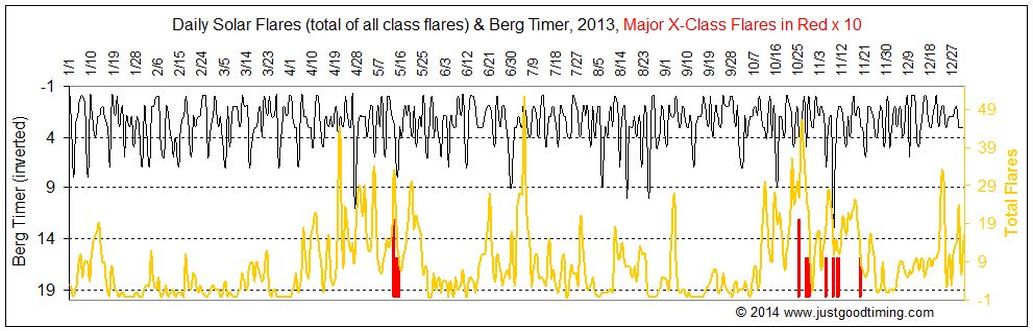
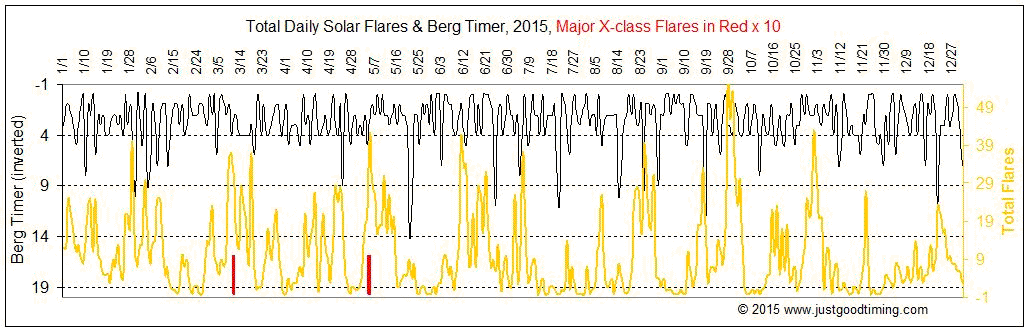
Below the Berg Timer is compared to total solar flares for 2011, 2012, 2013. Solar flares are most probable during the low BT points just before and after strong BT. High BT means astronomical symmetry is occurring. Calm Sun before and after the storms. The Great Sun/Earth Weather Cycle starts here.
Above also in red are the major flare events. The strongest daily BT of 2013 was on November 8. The year's first Winter storm crossed U.S. Nov. 5 to 10 and the strongest solar flare of the year on Nov. 5. Strongest Typhoon ever recorded on Nov. 7.
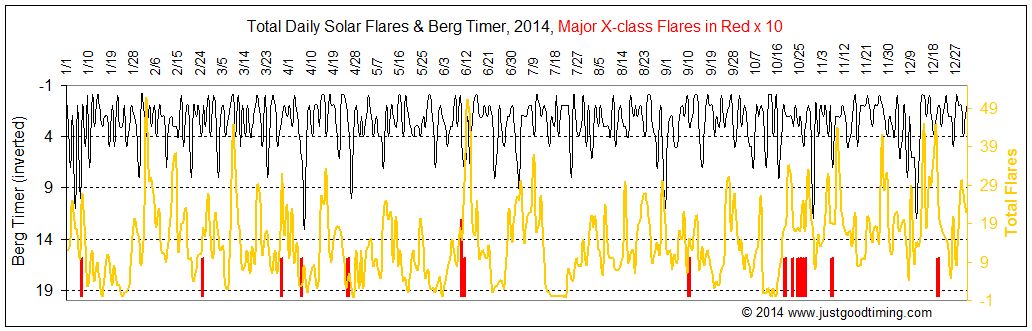
On January 7, 2014 a massive solar flare occurred immediately after two very strong Berg Timer values. It's unusual to have two very strong BT days together.
"A massive solar flare erupted from the sun on Tuesday (Jan. 7, ), rising up from what appears to be one of the largest sunspot groups seen on the star's surface in a decade, NASA officials say." source: www.space.com.
2005 Solar Flares
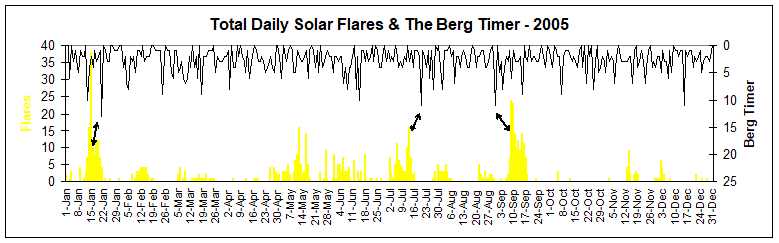
Below are total daily solar flares for 2005 compared to the Berg Timer. The three strongest flare periods occurred before and after the three strongest BT days. The calms before and after the storms.
 BT=13 on Jan 21, flares peaked Jan 15 -- within six days
BT=11 on July 20, flares peaked July 13 -- within seven days
BT=11 on Aug 31, flares peaked Sep 9 -- within nine days
The Sun Affects Weather, Geophysics, Behavior
Solar activity in the form of irradiance and charged particles affect Earth atmosphere, weather, oceans, geophysics and biosphere. There are various theories explaining the mechanics of this transition. In terms of weather, the strongest theories are that charged particles from the sun increase atmospheric nucleation thus cloud formation thus the weather.
Another proof that the Berg Timer is able to forecast Earth atmospheric changes is BT's correlation to atmospheric angular momentum (AAM).
BT affects solar activity which then affects atmospheric circulation which then has an effect on Earth's angular momentum. The AM of any object in motion is always constant unless its equilibrium is changed or if it's affected by outside influences. So in terms of Earth there are three basic factors which affect its angular momentum, its atmosphere, oceans and hydrosphere, and solid earth. Its atmosphere is responsible for about 90% of Earth's AM. Then oceans and solid earth the rest. Generally speaking, BT affects the Sun which affects the atmosphere which then affects the oceans via wind and temperature.
Much science has been done analyzing the atmosphere's affect on Earth motion. Opinion has come to acknowledge the sun's output as the major cause of Earth's weather variations and timing.
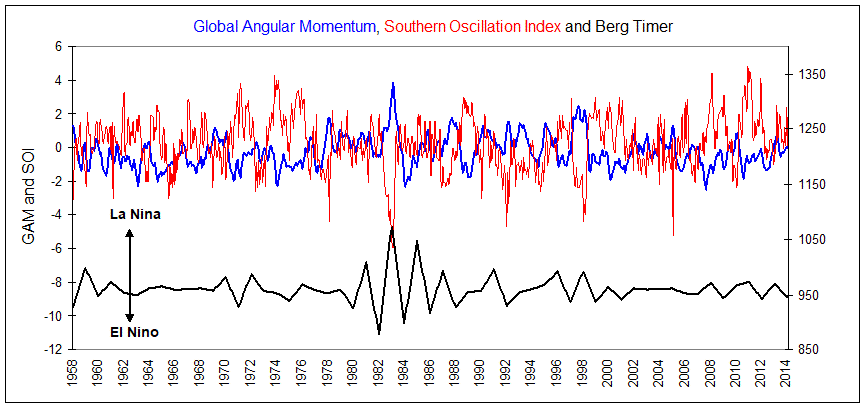
Below are compared monthly Global Angular Momentum and the yearly Berg Timer (with 1 year lag) from 1958 to 2014. Most noticeable is BT's positive correlation to global AM and negative correlation to the Southern Oscillation Index and thus El Nino. Both BT and GAM share their 56 year highs at the same time in 1983 which was also the strongest El Nino in recorded history.
Planetary positions, as represented by the Berg Timer, affect solar activity which then affects Earth atmosphere, thus the Earth's rotation rate, which then affects ocean currents. When atmospheric momentum increases the ocean's momentum must decrease. Earth's two major angular momentum components, the atmosphere and ocean, must compensate each other in order to retain Earth's total AM. If one goes up the other goes down. Thus the Sun is the driving force affecting the atmosphere, the timing of which is all predictable by BT.
High BT = High Angular Momentum = Low Southern Oscillation Index = El Nino. High BT affects solar activity causing warm Westerly Pacific equatorial winds to increase in speed moving warm water toward the South American coast. These high speed winds induce a slowing of Earth rotation since it's the principle of angular momentum that any change in one factor (atmosphere, oceans, or solid earth) has to be compensated for in another factor --- so the high winds' angular momentum slows down Earth rotation. Low BT, low AAM, high SOI, La Nina.
During an El Nino event high air pressure develops over the east Pacific ocean. This causes the west to east winds to strengthen which reduces upwelling of cool ocean water in the east, making the water warmer.
See below BT compared to the GAM and SOI. High Berg Timer causes atmospherics to strengthen winds from west to east Pacific. This is indicative of a high atmospheric angular momentum, so high BT in the graph correlates with the high GAM blue line. The east/west air pressure difference is indicated by the Southern Oscillation Index. It is low when El Nino condition exists. GAM and SOI move oppositely with respect to BT. It's interesting that the spanish terms El Nino (the little boy) and La Nina (the little girl) originated by fishermen on the west South American coast. Fishing becomes bad during an El Nino due to the warm waters and lack of upwelling cool water nutrients which attract fish. I've done a study of fishing totals and BT can reliably forecast those good and bad fishing periods. You can see that here.
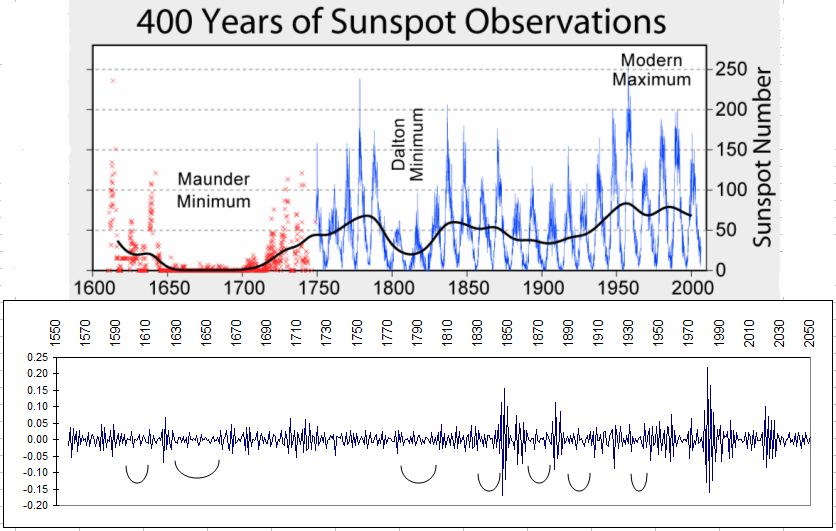
BT Accurately Forecasted Famous Sunspots' Maunder Minimum
The Maunder Minimum was a very unusual period in the history of solar activity and weather. It was a period coinciding with very cold temperatures in Europe dubbed `The Little Ice Age'. Very few sunspots were seen during those years. A similar low sunspot period called the 'Dalton Minimum' occurred in the early 1800's also coinciding with colder than normal weather in Europe. And the Maunder Minimum was the longest and weakest solar activity of the sun known to us and is one of the greatest mysteries of solar physics, until now.
Comparing BT to sunspots I discovered some amazing things.
I found that the Rate Of Change of the yearly Berg Timer during the last 520 years hits its two lowest periods during the Maunder Minimum and Dalton Minimum periods of sunspot activity. Low BT rate of change = low sunspots = low temperature. Also, the study just completed on BT and long-term temperature on the home page confirms this, since yearly BT coincides with historical low temperature periods.
What an historical discovery for weather and solar science!
It's interesting that during the European "Little Ice Age" caused by low solar activity the foundation was being grown which produced the most valuable violins in history. The Stradivarius violin was made during the late 1600's and early 1700's just after this cool period. This quote explains why the Stradivarius violin's tone is so good . . .
"Cool temperatures caused slow tree growth with consistent density with relatively low variation in the apparent growth patterns of the trees that produced this wood. Thus, how solar activity produced the highest quality violins in history".
(from Stoel, Berend C.; Borman, Terry M (2008). Grama, Ananth, ed. "A Comparison of Wood Density between Classical Cremonese and Modern Violins". PLoS ONE. 3 (7): e2554. doi:10.1371/journal.pone.0002554. PMC 2438473Freely accessible. PMID 18596937. Retrieved 2008-07-04. open access publication).
During the cool temperatures of the 1600's Little Ice Age, trees grew very slowly. Thus, the tree rings of these trees were very close together with low variation, producing the more clear violin tone which is so appealing. Violin makers are now trying to replicate the Stradivarius by searching for any remaining trees that are at least 350 years old. No news yet on their success. I guess they'll have to wait for the next very low period of BT and the next 'Little Ice Age'.
.
Lending interest and value to the possible causal relationship between heliocentric planetary positions and solar activity is the fact that this correlation fits best when the BT is lagged 22 years. This is interesting because the sun takes 22 years to complete each of its sunspot polarity cycles. For two of the longest low periods of BT to coincide with the same low periods of sunspots adds to the evidence that there's a mechanical link between planetary configurations, as represented by BT, and solar activity since both BT and solar activity involve the 22 year sunspot cycle.
These two BT minimums and other shorter low BT periods that correlate with low sunspot periods are marked with semi-circles in the chart above.
This finding lends support for my work relating BT to solar flares, weather, and other environmental indices of much shorter time frames which have been published in my early paper newsletters and on this website over the last 35 some years.
It's my belief that the mechanism for this planetary position/solar activity link is electromagnetic in nature, much like the mechanics of a simple electric motor.
I think the solar system is acting like a huge generator with the sun at the center being the magnetic rotor and the planets outside acting as the coil. The sun spins like a motor's rotor inducing electric current through the solar system by way of the planetary bodies, themselves conducting and propagating current.
Thus, the sun's output varies depending upon the placement of the planets. That's what one would expect for a motor with several coils (the planets) that are moving around a rotor, the sun.
For the planets and the sun coinciding with their lowest and longest low activity periods, the planets and the sun must be electromagnetically connected. Either that, or it's a huge coincidence.
Just as most of the planets have their own internal magnetic fields propagated by their own core's dynamo effect, so to does the sun. It looks like the sun is doing its own thing with regular 11 and 22 year sunspot cycles generated by its own internal dynamo. But then, once in a while, when the planets are in a sufficiently weak configuration, they cause the sun to lose the ability to propagate current through the solar system (via the interplanetary magnetic field), causing these low solar sunspot periods.
Thus, planetary configurations influence the sun's activity in an outside/feedback kind of way while the sun still maintains, for the most part, its own internal 11 and 22 year rhythms. And so too with most of the planets that have varying degrees of a magnetic field of their own. They are influenced by the sun's field and also have their own fields. The planets and the sun are both influenced and influential to each other at once.
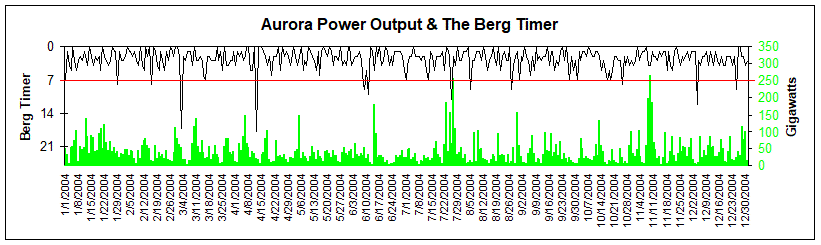
Aurora
The NOAA POES Hemispheric Power Data lists provide information about the estimated power in gigawatts deposited in the polar regions by energetic particles during transits over the poles by the NOAA POES (formerly called TIROS) satellites.
Below are compared the power output of Earth's North Pole Aurora and the Berg Timer for 2004 (inverted). Power output increases just before and after high BT, just like the Sun's solar flare increase before and after strong BT.
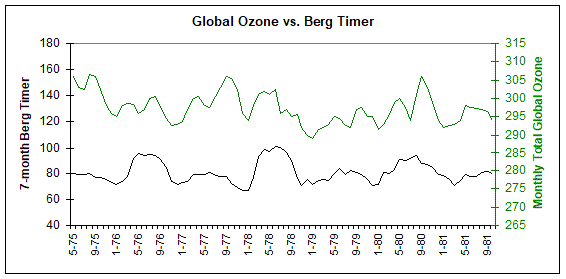
Global Ozone
Below are compared total monthly avg global ozone (60N to 60S Latitude) in Dobson Units and the 7-month Berg Timer.
This discovery goes way back to 1988 when I first published this in the WEF newsletter periodical and also presented it at the 'Foundation For The Study Of Cycles Symposium' of that year. Since ozone is produced by sunlight and with BT's correlation with solar activity, this BT/Ozone correlation is to be expected.
There are two basic schools of thought with regard to why we were scared a while ago about our ozone layer decreasing. On one side are the chemists who support the view that ozone is decreasing because of CFC's in our atmosphere. On the other side are the dynamicists who view that ozone depletion is part of a natural atmospheric cycle. This is/was a hot political topic because environmentalists want stricter controls on chemical companies.
The correlation above sheds some light on this controversy. It may in fact substantiate the dynamicists' point of view that the ozone decrease scare of 1982-83 (a period of the strongest El Nino in history) was a natural phenomenon as indicated by the remarkable similarity between BT and ozone.
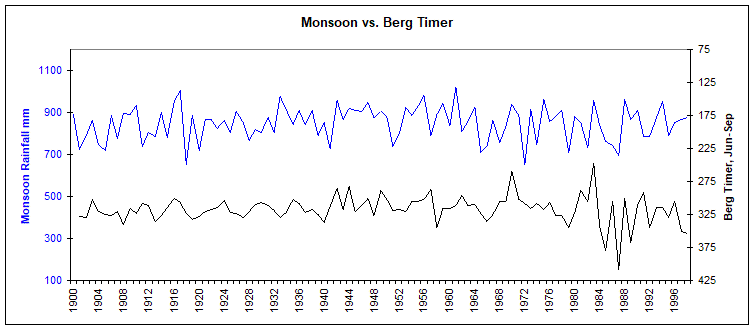
Monsoon
Below are compared the yearly Berg Timer (Jun to Sep each year) and Summer Monsoon in India.
Indian Monsoon is directly related to the strength of the Southern Oscillation Index. Low Summer BT = High India Monsoon Precipitation.
data source: IRI Data Library
El Nino
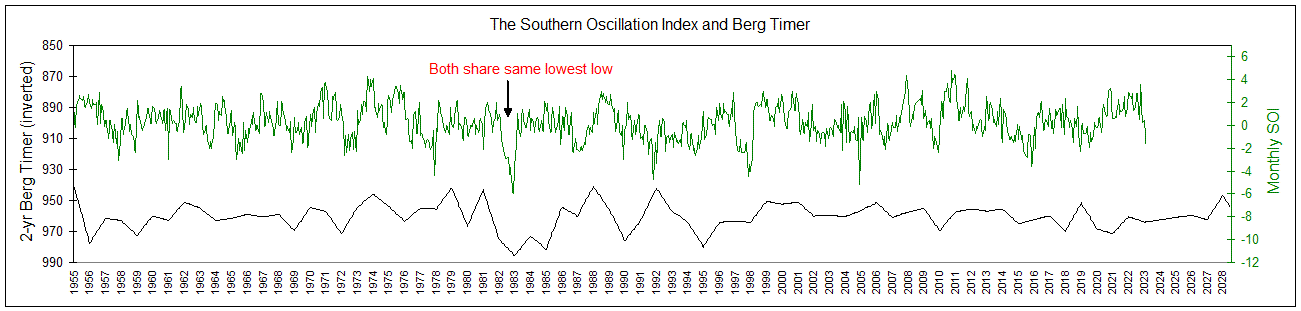
Below are compared the monthly Southern Oscillation Index and 2-yr Berg Timer (inverted) since 1955 with forecast through 2031.
High BT = High probability of El Nino. BT is increasingly getting stronger (inverted in charts below), thus El Nino getting more likely in 2023, especially if August continues with strengthening El Nino, decreasing the likelihood of Atlantic hurricanes.
A low SOI is indicative of El Nino (equatorial Pacific ocean warming). A high SOI is indicative of La Nina (equatorial Pacific ocean cooling). Most noteworthy is the very strong and unanticipated El Nino of 1983 which was precisely forecasted by the Berg Timer. Low BT also equals High India Monsoon and Australian drought (see Monsoon chart immediately above this section).
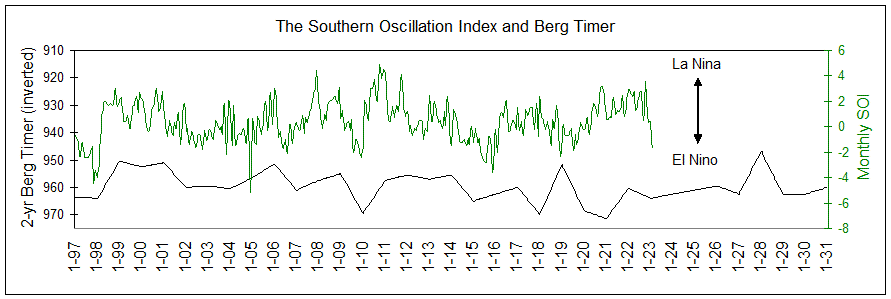
Below is SOI compared to the Berg Timer. BT exactly hit many highs and lows perfectly. It correctly forecasted the decline through to early 2010, forecasting the 2010 El Nino, then the up trend to December 2011, correctly forecasted the La Nina. Here in mid-2023, BT is saying that we are in an early El Nino. The BT is forecasted for SOI through to 2031.
BT can be forecasted infinitely forward because it's based on planetary positions which can be calculated infinitely into the future without loss of reliability.
This powerful correlation gives credence to a strong natural connection between astronomical tides and our oceans. The mechanism is unproven. There are several theories. My opinion is that it is due to BT's effect on the Sun and thus atmospheric circulation and thus atmospheric angular momentum, thus air pressure, wind and the Earth's rotation rate, which then affects ocean currents, and, thus, El Nino.
There are many weather-related uses for knowing when El Nino/La Nina will occur. A very human, practical application of being able to predict the occurrance of malaria epidemics by knowing when El Nino will occur is provided in the following scientific study:
"A statistically significant relationship was found between El Niño and malaria epidemics in Colombia, Guyana, Peru, and Venezuela. We demonstrate that flooding engenders malaria epidemics in the dry coastal region of northern Peru, while droughts favor the development of epidemics in Colombia and Guyana, and epidemics lag a drought by 1 year in Venezuela."
The El Niño Southern Oscillation and malaria epidemics in South America, Int J Biometeorol (2002) 46: 81-89, Alexandre S. Gagnon1, Karen E. Smoyer-Tomic2, and Andrew B. G. Bush2
Mr. Berg,
Thank you for sharing the Berg Timer method of forecasting El Nino and other phenomena. I will be interested to see how it performs as a prognostic tool for evolution of the Southern Oscillation Index during the next few years. This is very useful information. Thank you again for sharing.
L.R. May 14, 2012.
Thank you for your letter. It looks like La Nina increasing slightly in 2013 peaking Jan 2014, then tendency towards El Nino all of 2014, ending Jan 2015. Tendency toward La Nina from Jan 2015 through to Jan 2017. Then toward El Nino through to the end of 2017. Toward La Nina from Jan 2018 to Jan 2019.
Larry Berg, May 22, 2012.
Water Quality
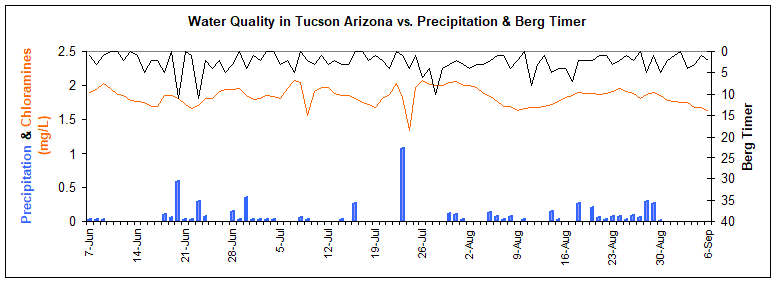
Below are compared Precipitation, Water Quality (Chloramines) and Berg Timer for Tucson Arizona during the Summer of 2000.
BT can forecast daily precipitation. When BT is "0" precipitation is most probable in Arizona. Precipitation causes Chloramine levels to immediately drop after a rain. So BT can forecast water quality everywhere that gets its water from fresh water lakes, rivers and streams. Low BT = peaking Chloramine levels.
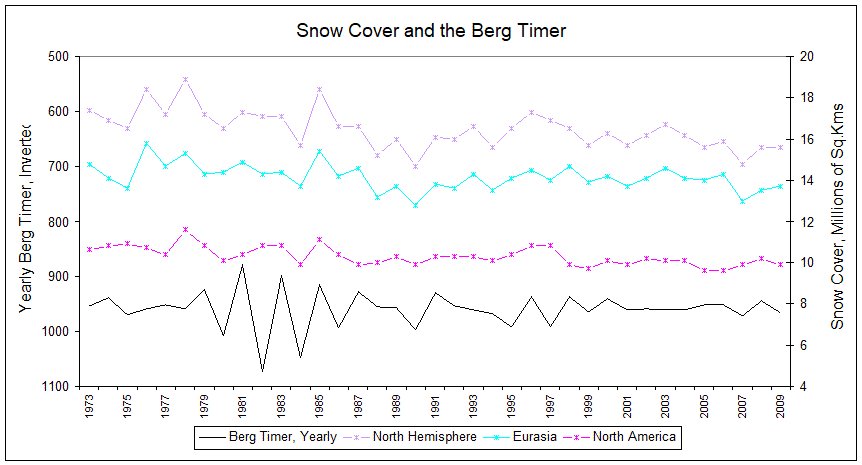
Snow Depth - North Hemisphere & Eurasia
Below are compared yearly snow cover in the Northern Hemisphere, Eurasia and North America and yearly Berg Timer inverted. When BT is low, snow cover is high. Very good correlation here.
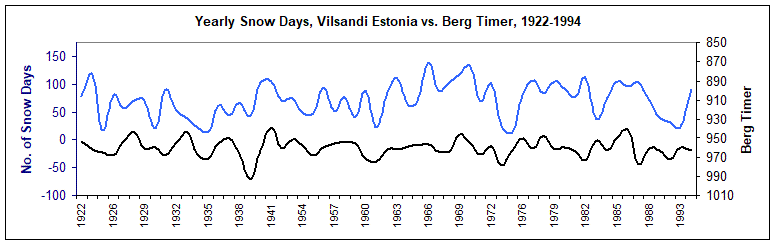
Snow Frequency - Estonia
Below are compared number of days of snow each year in Estonia and the 2 year Berg Timer (inverted) from 1922 to 1994.
Low BT = high snow frequency.