Whole Earth Forecaster home
Economics | Weather | Human Behavior | Natural Disasters | The Environment | Your Page to Forecast Your Weather
The Berg Timer, its History and Calculation
A scientifically based indicator which can forecast Solar Activity, Climate, Seismicity, Economic Trends, Weather, and everything affected by weather,
which is just about everything.
. . . discovered, researched, written, and published by Larry Berg
The Berg Timer calculation instructions are discussed below.
BT data and Stock Market Day Trading and Swing Trading Systems information is on the Products page.
Berg Timer charts and BT calculation instructions are freely available to copy and share with credit please to Larry Berg and justgoodtiming.com.
Good timing!
All truth passes through three stages. First, it is ridiculed. Second, it is absolutely opposed. Third, it is accepted as being self-evident.
- attributed to German Philosopher Arthur Schopenhauer, ~ 1861
Table of Contents
Acknowledgments
What's in a Name?
Childhood Experiences
Age 5 to 10, motivation
Age 11, abstraction
Age 13 to 15, vigor
Age 16 to 18, apathy
Age 19 to 24, the prodigal scientist
Beginning My Studies
Astrologer extraordinaire
To find a career
Cave man.
The Berg Timer Method Takes Shape
The key to its use was its proper display.
No preliminary conclusion
Discovery
For example
Why does it work?
About Astrology
Conclusions & Reflections
My Work In the Bible Code
Acknowledgements
I dedicate the discovery of The Berg Timer Method to my family, without whose faith, support, and tolerance this work could not have been accomplished. Specifically,
to grandmother Herrald, whose cooking warmed the heart of an energetic youth;
to grandfather Herrald, who knew that everything always moved in cycles;
to grandmother Berg, who taught me the value of integrity;
to grandfather Berg, whose kindness I'll always carry with me;
to Uncle Bob, who loved life;
to Uncle Fletch & Aunt Ginny, who give new meaning to the game of bridge;
to my brother, sister-in-law, and nieces/nephews from whom I receive much joy and happiness;
to my Capricorn father, from whom I learned the value of hard work;
to my Aquarian mother, who's my best friend;
to my wife and sons who inspire me to continue;
to the Lord, who provides the steps so that I may determine the way.
The mind of Man plans his way, but the Lord directs his steps.
Proverbs 16:9
Thank you all.
What's in a Name?
I recently received a call from one of my Whole Earth Forecaster newsletter subscribers. He ordered the Berg Timer and wanted to know how long it would take to get "the key to the universe". I thought at the time, what a great name that would have been.
A name for what I do is a lot more simple. I am an astrometeorologist or astrobiologist, a student and researcher of the way the planets and sun interact to affect physics, weather and biology. The Home page gives a detailed cause/effect of how the sun affects our weather. So, since the Berg Timer can forecast solar activity, it can also forecast weather. When you can forecast weather for anywhere in the world, well, you can forecast a lot of other things.
What isn't affected by the weather?
My first work began with an interest in astrology and then trying to forecast the ups and downs of the stock and commodity markets. This work led me into discovering the Berg Timer and noticing that it could forecast weather. The Berg Timer Method forecasts times of climate change, and the financial markets seem to be affected both through weather's effect on commodity production and through weather's effect on human psychology. What better barometer of human psychology is there than the markets?
I found that the Berg Timer could forecast temperature, precipitation, atmospheric circulation and cyclones/hurricanes, and almost all forms of economic activity, e.g., the stock market, commodity markets, interest rates, loans, production, housing, literally everything related to either weather or human behavior (which is just about everything!). BT also does a good job of forecasting planetary variables such as earthquakes, El Nino and solar flares. The physics of this isn't clear. The mechanism responsible for the effect of astronomical tides upon the planets and sun may be something other than gravity and electromagnetism or a possible combination of both, like Einstein's unified field theory. It's energized me into thinking more in terms of science as a whole, rather than separate parts. There's something here for the solar physicist, the meteorologist, the farmer, the medical doctor, the psychiatrist, the financier, the chemist, the environmentalist, the government policy makers . . . it goes on and on. I've always felt that I've had a tiger by the tail with this thing. What isn't related to the weather? If you can forecast the weather, well, you've got your hands full! And I have. I have always felt I've had a tiger by the tail . . . that this will take a lifetime. It has.
Many physicists are studying planetary tidal effects on solar activity and weather. They mostly put it into the subject of gravitational tidal theory. I think it's something totally different. My methodology is presented here for forecasting all natural cycles in our environment.
What I'm presenting here is new science. I don't believe it's new physics, I know it is new physics.
And God said,
Let there be lights in the firmament of the heaven
to divide the day from the night;
and let them be for signs,
and for seasons,
and for day,
and years.
The Holy Bible, Genesis I:14.
Childhood Experiences 
Age 5 to 10, (1959-1964) motivation
I'd look out of our upstairs window every night to see if he was in his backyard using his telescope. More often than not, he wasn't. But during the day we'd sometimes have lunch together on his back porch and he'd let me go down to his basement workshop and watch him grind lenses to make his homemade telescopes. He had charts of the solar system and planets taped to the wall and I could sense the intense interest he had in his work.
He was tall and thin with thick, snow-white hair and he wore black-rimmed glasses. I admired his quiet pursuits of astronomy. He was happy and willing to share his time with me, but he didn't talk much. He was always consumed in his work. I think after he let me view the moon one night with his new homemade telescope, he vowed to himself never to let me around again. I think I asked too many questions for his liking. But even one look would have been enough for me. Never before had I seen the detail of the moon's craters so lifelike. And it was moving! I was hooked.
When we neighborhood kids played hide-and-seek, I was never found because, above his workshop, just above the foundation of his house, was one of those crawlspaces that nobody I know has a use for. I found a use for it. I was never found hiding there by my friends. I found a use for the solar system, too, that nobody else found.
Age 11, (1965) abstraction
When I reached the sixth grade, my curiosity in astronomy was again aroused by a comment from my sixth grade teacher, Mrs. Jett, a wise old lady, who always made me keep my fingernails clean. We were talking about atoms and molecules in class, and she made a remarkable analogy. She equated the solar system to an atom with its electrons revolving about the nucleus like planets around the sun. That opened up my awareness to the size of things and to the potential for the universe's interrelatedness. There was an order to things.
Age 13 to 15, (1967-1969) vigor
Grades 7-9 were good years. I went to a good public school, with good teachers, and made good grades. My classmates were also highly motivated. We were all interested in science and space. Star Trek was the new show on TV. We even started a science club. I think the motivation and high achievement of my friends affected me more than my teachers. We shared common scientific interests and ambitions. I'll remember those three years as being the most academically positive of my childhood.
Age 16 to 18, (1970-1972) apathy
My high school years were 1970-72. I went to a good school but lacked the self-direction and motivation of my junior high years. It was probably a combination of being a teenager and the times in which we were living. The school was literally jammed with students. The hallway between classes was like a sardine can. Vietnam was raging. Girls looked better than they did in junior high. And then there was that invenerable cure-all for the disease called homework . . . the automobile. This was not the best of environments for concentrating on one's personal goals.
Age 19 to 24, (1973-1978) the prodigal scientist
My first years at the University of Nebraska were not much different from high school. As with most, I was uncertain of a career choice. I started in Journalism to prepare for entering my father's advertising business. Not that advertising isn't exciting and monetarily rewarding, but somehow I knew I wouldn't be happy in the advertising business. If there's such a thing as a born-again scientist, I think I experienced it on a December day in 1973.
I was waiting for a plane connection in the Denver airport on my way back from visiting my brother for Christmas. He had just graduated from the U.S. Naval Academy and was stationed in San Diego. I strolled into the magazine store and was looking for something to read when I spotted one, lone, paperback manual on how to cast horoscopes. I thought it might be fun. So I thumbed through it. I liked the order and the exactness of it. It seemed like, right then and there, I picked up where I'd left off four years ago in junior high. It turned on my scientific interests again. I knew it instinctively as I read the first page. The order, reliability, exactness, and predictability of planetary movements dominated my every thought. I quit the university in 1976 with one semester left until graduation. I knew what I wanted to do and another semester to wait was too long. Looking back, I guess quitting school was a statement to myself of how sure I was of where I was going. An education is certainly a very good thing and I'm grateful for it. I learned great skills in college, writing, liberal arts and some science and business which would help me in my journey. But I knew that what I found would take me on a different road, a road where a degree in Journalism was just not necessary.
Beginning My Studies
Astrologer Extraordinaire
I taught myself all the intricacies of planetary motions, astrological charting, and horoscope interpretation. In fact, my knowledge of astrological traits was so thorough that I could often guess a person's astrological sign by observation. I remember guessing a young coed's astrological sign at a fraternity party, on the first try. I guessed she was a Taurus because of her sturdy physique and her slow and deliberate way of moving. There are certain traits that are almost always present within each sun-sign. It's very easy to do once you know what to look for. There's really nothing mystical about it at all. On a cruise I noticed that our captain acted and even looked like my college roommate. I told him I knew he was a Pisces. I was right. At an airport ticket counter I asked the agent if she was a Libra. With an amazed look she said 'yes!', and then I explained that I knew Libra well because my high school girlfriend was a Libra. It's just a matter of observation.
By my late college days I was convinced that season of birth had an effect on human beings and so I began to wonder about its implications on a broader scale. I felt like I was being led to something. No . . . driven.
To Find a Career
If astrology worked on an individual basis I knew it should work somehow on a larger scale. I wanted to apply astronomical cycles to general trends in the world as a whole.
My basic thinking was that I had to make some kind of synthesis of how planetary movements affect things in general such as weather, economics and health. As far back as I could remember, I was always intrigued by the financial quotes page of the newspaper. I knew there must be a way to forecast stock market prices using natural cycles. And the weather, too. I was determined to discover a way to forecast the two most complex systems in the world, the financial markets and the weather.
I first tried to apply planetary cycles to economic cycles and the stock market. I figured that if planetary positions affect people then they must affect the movements of the stock market. And if I could figure it out, I knew that I would have a job for the rest of my life since the stock market will always be there.
Cave Man
1977-1981 marked the beginning of a sort of self-imposed exile from the human race. My brother was particularly worried about me. He would ask, "What are you doing?" "Are you Ok?" I sacrificed much for my work. Friendships went by the wayside. Every moment of my waking life (and often sleeping life) was occupied with thoughts of how the planetary cycles worked. I wanted to make one indicator which would show the tug and push of planetary rhythms when applied to various world-wide events like weather and economic activity.
My first work started with comparing geocentric (Earth-centered) planetary angles to the stock market. I charted all the traditional astrological angles (0, 60, 90, 120, 180) in horizontal time graphs using a different colored pencil for each angle. Then I lined that up to the stock market to see if any certain angle correlated with the market. My bedroom walls were covered with stock market/planetary angle charts. Although I couldn't find any relationship, one thing stood out.
When conjunctions occurred, when two planets were together in the same degree of longitude, the stock market usually reversed direction. This was a major discovery, but conjunctions occurred infrequently and there was much stock market activity for which I could not account. I couldn't see any effect of the other angles that affected the stock market, besides the conjunction.
My reading of The Jupiter Effect by Plage and Gribbin changed the way I approached my research. That book changed my research from an Earth centered to a Sun centered perspective. It made sense that the planets' positions aren't affecting the Earth in particular, they are affecting the sun, which then affects us. So I walked away from the geocentric, Earth-centered philosophy into a more all-inclusive, heliocentric, Sun-centered view of things. I re-did everything I'd previously done in geocentric figures, with heliocentric numbers. I did a couple months in heliocentric and immediately found better alignment to the stock market than with geocentric numbers. I believed then that the sun was being affected by the planetary alignments, which in turn affected Earth and all planetary bodies.
The planets-affecting-Sun-affecting-Earth theory drew me to the study of solar data and relating it to planetary cycles. I wasn't a physicist, but I could chart statistics, and solar statistics compared to planetary cycles were showing startling similarities. Conjunctions usually caused increased solar activity (there are published papers supporting this claim as shown below).
Since conjunctions worked, I figured there must be other planetary relationships to the markets and the sun. Even though the traditional astrological angles didn't work, maybe other angles would. If the market made tops when, for instance, the angle of 43.8 degrees occurred, I had to have a way of knowing it. So instead, of doing a numbers game on each possible angle, which would involve infinite possibilities, I decided to actually draw out each planetary relationship in terms of cycles. This necessitated a visual format for my analysis.
The Berg Timer Method Takes Shape
The Key To Its Use Was Its Proper Display
Another book which had an effect on my work was the well know Cycles by Edward Dewey, from The Foundation For The Study of Cycles. I was looking for a way of combining all the planetary cycles so that I could see the interrelationships between the cycles. It would have to be some sort of line plot. On page 116 of Cycles it describes the effect of combining several oscillating cycles into one cycle. That gave me the idea to plot the planetary cycles into an oscillating line chart. So I set up a graphic chart with y axis from 0 to 180 degrees (two planets are never more than 180 degrees apart). The 'x' axis represented time.
I charted each planetary pair based on their longitudinal differences. I started with the slowest moving planets (Jupiter Saturn Uranus Neptune Pluto) since they should show the longer market trends. I looked up each planet's longitude in an ephemeris. If Jupiter's longitude were say 120 degrees on January 1, and Saturn's longitude were 140 degrees longitude on January 1, I would enter a dot on the graph on January 1 at the 20 degree point. This point represents the difference between Jupiter and Saturn longitudes on Jan 1. I would do the same for each Jan 1 for as many years as I wanted. The next chart shows how a hypothetical graph of the Jupiter/Saturn relationship for eleven years might look.
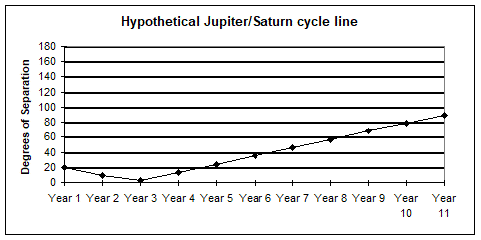
When the line is at "0", which occurs on the third year, that means that Jupiter and Saturn were in conjunction, that is, they both were in the same degree of longitude. When the line is at 180 this means that the two planets were 180 degrees apart and is called an "opposition".
I then went on to plot all the other major planetary pairs, e.g., Jupiter/Uranus, Jupiter/Neptune, Jupiter/Pluto, Saturn/Uranus, Saturn/Neptune, Saturn/Pluto, Uranus/Neptune, Uranus/Pluto and Neptune/Pluto. When I finished I got something like the graph below.
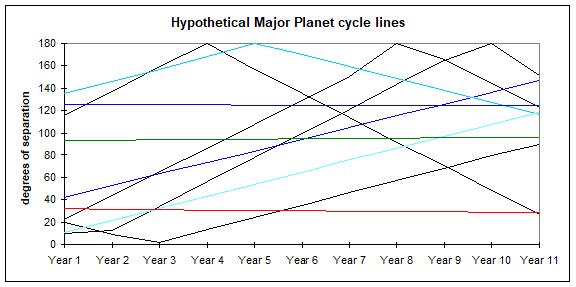
You'll notice the ones going almost straight across. Those are the cycle line longitude differences of the slowest moving planet comparisons, Uranus/Neptune, Uranus/Pluto and Neptune/Pluto. They don't change as quickly.
No Preliminary Conclusion
After I plotted all ten of the longitude comparisons of the five slow moving planets, I now had a cycle-line drawing which represented, at any moment in time, the interrelationships of the major planets. I believed now that if there were anything to this planetary angle effect on the stock market, this should show it.
I analyzed the market with respect to the major planetary cycles to see what was happening with the planet angles at important market tops and bottoms. As mentioned earlier, the market made important tops at conjunctions, but I could find no correlation between the market and the traditional astrological angles (45, 60, 90, 120 degrees). I also added up the cycles vertically and averaged the cycles to get one cycle and that didn't show any similarity to stock market activity either. It didn't look like I was going to find a correlation between planetary angles and the market, aside from the conjunction effect.
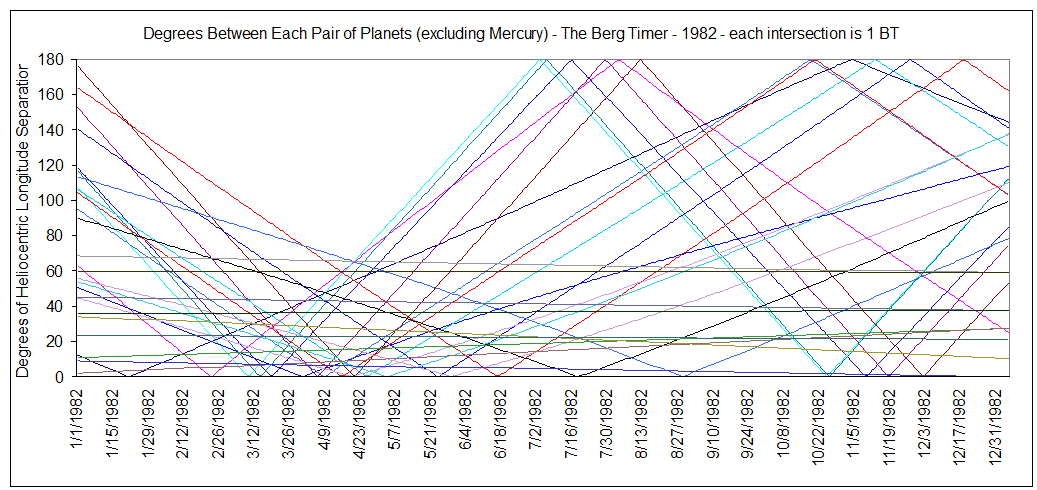
Above is a chart showing the 28 pairs of planets charted for 1982. Look at what happened April 14-15. Those two days totaled 31 BT which was the strongest 2-day period ever since as far back as I've calculated BT, 1400 years. This chart doesn't include Mercury.
In addition to the major planets, I also did the minor planets hoping they would show minor market changes, even if the major planets didn't. This undertaking took about a year and involved calculating and charting all 28 of the possible planetary pairs for a 10-year period. Still, I could find no correlation.
I agonized over this realization for some time. I'd worked for several years making hundreds of cycle charts by hand, and even reworking years of charts over and over again, combining different planetary mixes. This was before the personal computer. All the calculations and cycle line drawings were done by hand on graph paper.
Maybe some planets worked and others didn't? Nope. I found the exclusion of any planet of no help.
Maybe just the Moon and other planets? Nope. The inclusion of the Moon just made it more confusing.
Maybe just the Moon? Nope.
Maybe I should also consider the planets' latitudes (declination)? Nope. Declination didn't matter.
Maybe I should also consider how close the planets were to the sun (aphelion, perihelion)? Nope. No help.
I could find no other correlation between planetary angles and the stock market, besides the conjunction. I even analyzed horoscopes of the New York Stock Exchange to predict market turns, like traditional astrology. I found no correlation.
About six months went by, during which time I laid aside my work and considered starting a new career. Once in a while I'd think of new combinations of planetary angles and tried them out. Still nothing worked---until the winter of 1980.
Discovery
I remember well, November 19, 1980. It was about 1:45 PM. I was sitting on the edge of my waterbed, thinking about those damn cycles, as usual.
I remembered that, on my major cycle graph, the market changed direction when two of the cycles intersected. So I went back to the major planet cycle graph to confirm my memory, and it was so. The market usually reversed direction when two cycle lines intersected. It didn't matter at what degree of longitude they intersected. Whenever they intersected, the market usually reversed direction. I knew immediately that this was the indicator for which I was looking. But what was the rationale for this? It was very simple.
What the intersections of cycle lines represented were times when two planets were heliocentrically longitudinally equidistant from a third. So if, say, the Uranus/Pluto cycle line and the Uranus/Venus cycle line intersected, that meant that Uranus was longitudinally equidistant from both Pluto and Venus at that moment in time. Those three planets could be said to be in a state of symmetry or harmony.
The Berg Timer Method combines all the possible harmonics made by all the planetary positions. Whenever two planets are longitudinally equidistant from a third, a planetary harmonic exists. . . it doesn't matter at what angle, 61, 98, 56.3, 129.46, whenever two planets are longitudinally equidistant from a third, a harmonic exists which has power to affect solar activity, Earth environment, the birds and the bees, and you and me.
For Example
The Berg Timer Method makes it possible to see every angular harmonic occurrence at any moment in time. Whenever the planets align themselves up into a harmonic relationship, the intersections of planetary cycle lines show it. There are times when as many as nine cycle lines intersect on the same day, making for a very strong harmonic day. This occurred on January 14, 1973. Let's examine what happened that day.
Mercury was at 267 degrees heliocentric longitude, Venus 245, Earth 115, Mars 224, Jupiter 290, Saturn 78, Uranus 200, Neptune 245, and Pluto 182. At first glance, it doesn't look very significant. However a little math shows that:
* Venus and Mars were 21 degrees apart, and Mars and Neptune were 21 degrees apart.
* Venus and Neptune were 0 degrees apart (conjunction).
* Venus and Jupiter were 45 degrees apart, Neptune and Jupiter were 45 degrees apart, and Neptune and Uranus were 45 degrees apart.
* Venus and Earth were 130 degrees apart, and Earth and Neptune were 130 degrees apart.
* Neptune and Mercury were 22 degrees apart, and Mercury and Jupiter were 22 degrees apart.
It's not a coincidence that within one day of January 14, 1973 the stock market made the exact historic peak of the 70's stock market rise to 1,050, a peak that lasted for eleven years. When The Berg Timer is strong, the market usually reverses direction.
This particular harmonic day also demonstrated itself in other ways. January 15 was an exact turning day for U.S. temperatures. They hit a peak on the 15th and then abruptly turned colder. In the center of the country, temperatures on January 14-15 were in the 50's. A week earlier they were around 10 below. A week later they were down to 10 degrees again.
Strong BT is indicative of developing weather fronts. Long-term (on a yearly basis) when BT is strong it also means temperatures have peaked and will move lower (I now know it depends if you're an inland location or an oceanside location). Two basic regions of Earth react oppositely to BT. Some areas react positively with daily BT, others negatively. The timing of major weather/atmospheric movements can be predicted by BT. I'm just beginning to fathom the complexity of this world weather organism. But it appears as though Earth's major weather reaction to the Berg Timer is like the two sections of a baseball, with one section of Earth reacting positively and the other negatively to changes in solar activity. This is probably due to Earth atmospheric circulation.
Strong BT days usually indicate the occurrence of severe storms in both winter and summer. Strong BT days evidently affect atmospheric circulation and ocean movement and temperature, causing the Jet Stream to dip down into the U.S. interior, generating storm systems. Low yearly BT correlates with low U.S. precipitation and drought as in 1975, 1988 and 2001/2002. For more information on how BT indicates weather for your part of the world please visit the Weather section.
Why does it work?
Viewing the solar system as a whole, the most plausible cause for the BT effect seems to be electromagnetic in nature; the planets' magnetic fields may interact with the solar wind in a way in which we are not yet aware. Einstein spent the last 25 years of his life trying to combine gravity and electromagnetism into a unified field theory. Perhaps the Berg Timer Method may enhance work on that subject, acting as a catalyst for new studies in celestial physics.
Most currently held theories of planetary effects center around their tidal effect on the sun. I quote below some statements made by physicists and other professionals who have presented their theories concerning the effect of planetary angles on the sun. Most of the papers deal with the subject from a gravitational/tidal point of view. There seems to be general agreement that the planets have a tidal effect on the sun. However, I don't believe the gravitational effect of the planets is strong enough to account for the empirical correlations I've found between BT, the sun, weather and our biosphere. It's something entirely new. It's new physics.
The Berg Timer Method is tempting us to pursue a new, very subtle force of the universe. In fact, I think that this "force" can be better described as an "unforce". An anti-matter force. Einstein taught us the gravitational space/time value of material bodies. BT is a force of the spaces between matter.
Below are attempts at planetary effects theories . . .
"This work shows not only a good correlation between planetary synodic period resonances with solar activity period, but also a rough correlation between the variations of the resonance period resulting from orbit eccentricity and the variations of the sunspot period."
Robert M. Wood, McDonnell Douglas, Nature, Vol 255 (May 22, 1975).
"There seems to be a definite relationship between the orbital periods of the planets and the periodic nature of the sunspot cycle, and the relationship depends on a non-linearity in the solar energy conversion system."
R.A. Burear & L.B. Craine, Electrical Eng., Wash. St. Univ., Nature, Vol 228 (Dec 5, '70).
"It is found empirically that solar activity is preceded by planetary conjunctions. A long-range prediction technique has been in use for 2.5 years, which predicts flares and proton events months in advance."
J.B. Blizard, Denver University, American Physical Society Bulletin #13, June 1968.
"The relationships set forth here imply that certain dynamic forces exerted on the sun by the motions of the planets are the cause of the sunspot activity."
Paul D. Jose, Aerospace Research, USAF, The Astronomical Journal, Vol 70 (April 1965).
"In summation, after more than 25 years of research in this field of solar system science, I can say without equivocation that there is very strong evidence that the planets, when in certain predictable arrangements, do cause changes to take place in those solar radiations that control our ionosphere.
I have no solid theory to explain what I have observed, but the similarity between an electric generator with its carefully placed magnets and the sun with its ever-changing planets is intriguing. In the generator, the magnets are fixed and produce a constant electrical current. If we consider that the planets are magnets and the sun is the armature, we have a considerable similarity to the generator. However, in this case, the magnets are moving. For this reason, the electrical-magnetic stability of the solar system varies widely. This is what one would expect."
J.H. Nelson, short-wave radiowave analyst, RCA communications, Cosmic Patterns, 1974.
"Professor Wood has elaborated on the various tidal influences due to Venus, Earth, and Jupiter in detail. When all three planets are aligned, their combined tidal effects add together on the sun's surface. Wood then calculates the magnitude of their tidal influence in order to get the height of the gravitational tide raised on the sun by the three planets at any time in the future or past. It was then a simple matter for him to compare the tidal height with sunspot activity over the nineteenth and twentieth centuries. The results show that the relation between sunspot activity and these tidal influences is completely beyond question.
Dr. E. Opik has shown that Wood's tidal gravitational effects should raise a tidal flow on the sun of over one-half of the sun's rotation of 560 km in a horizontal direction which may suffice to trigger off some unspecified instabilities leading to sunspot activity. No one has yet proposed a specific and detailed mechanism for the
interaction of planetary resonances and solar activity characteristics. This would require a complete magnetic-hydrodynamical treatment of the external tidal and the inertial forces within the Sun.
One alternative model in particular seems a strong rival to the direct tidal theory. That is the possibility that changes in the position of the Solar System center of mass play a significant part in determining the level of solar activity. As the planets, especially the giants, move around the sun they swing it backwards and forwards and around like circling ice skaters holding hands with one another.
Torque effects have also been discussed, notably by R.M. Wood and by Blizard, in connection with the link between planets and sunspots, with partial success when applied to the 22-year cycle. Perhaps more than one of these mechanisms is operating, but there seems to us no doubt that some physical mechanism does indeed link the positions of the planets to solar activity. . ."
John R. Gribbin, editor of Nature, and Stephen Plagemann, Institute of Theoretical Astronomy, England., The Jupiter Effect, 1976.
About Astrology
. . . a word about astrology. When I learned the truth and value of astrology, it gave me the confidence to pursue the planetary effects further and to eventually develop the Berg Timer. Astrological interpretation and meaning is based on centuries of behavior observation related to season of birth. Its practice is as old as human civilization. Such a long history of observation demands a certain degree of respect. Observation is a legitimate means of scientific study, and very often the starting point of serious research.
Be that as it may, I'd like to take this opportunity to express my opinion that testing and experience has required me to distrust the following astrological practices:
---Most astrology emphasizes the planetary angles of 0, 60, 90, 120, and 180 degrees and characterizes them as "good" or "bad" or "difficult" in horoscope interpretation. In my opinion, Nature is neutral, and shouldn't be characterized as good or bad. Nature is good or bad depending upon our point of view (rain is good for the farmer but bad for the golfer). The characterization of planetary angles as good, bad, easy, hard, difficult, or whatever, should be deleted from astrological interpretation. They are just forces, inherently neither good nor bad.
---Natal chart progressions. This is the practice of figuring a person's important life events based on movements of the planets immediately after birth. There isn't any logic behind it and I've personally found it to be unreliable. Life events are best forecasted by comparing planetary transits of a natal chart.
---Electional astrology. This attempts to predict "good" times for starting things. Again, angles aren't good or bad. And there is no evidence.
---Locational astrology. This is the theory that each "place" has its own astrological imprint and that one can find a compatible place to live by using this. Again, I've seen no evidence for this. It is impossible to go about researching this theory.
---Astrological charting of non-living things like countries, places, events, corporations, etc. Planetary positions do not affect a piece of paper such as a corporation or contract. There are obviously good times for beginning businesses based on local and national economics (which BT can forecast). But there is no reason to believe that a country, a corporation or a grand opening is affected, in and of itself, by planetary positions. They are not living, breathing, things. This is another area where astrology has gotten itself way out in left field.
Evidence has shown, and all astrologers agree, that the basic nature and personality of an individual can be known through the planet and sign placements in the natal horoscope, and that the present and future tendencies of individuals and generations can be known based on planetary transits. That's simple, basic astrology. It works, and it will always work. In my opinion, any exercise outside of that is unknown, untested, and unproven territory.
I've found astrology in relation to eras of time to be frequently on the mark and a fascinating area of research. For instance, my generation was born with Neptune in Libra, denoting a period when indecision and naivety could be experienced with respect to religion. Indeed, my generation was one which was deceived by various religious activities, as was evident by the promulgation of religious cults in the 1970's. And its mark as "the flower power" generation is very typical of the peaceful Libran's personality. There are many other examples of the validity of generational astrology. Again, astrology affects living breathing natural things, not corporations or Uncle Roger's car.
The Whole Earth Forecaster newsletter began in 1981, starting the long road to discovery. It was through the newsletter that I first presented most of the analysis and correlations now provided on the website www.justgoodtiming.com. I continue to add to my findings on the website. There is no end to this work. Like I said, it is like having a tiger by the tail.
How To Calculate The Berg Timer
All calculations and charting was done by hand when I first began my work. I have since developed software spreadsheets using Excel which calculate BT automatically in seconds which previously took me several days to do by hand.
We'll go through every step here and do one week of the indicator. You can, of course, do as much time at once as you want when you start doing it yourself. However, we're dealing with lines here that have to be seen well, so the smaller the time scale the better. The process will take some getting used to in the beginning. Even with a computer to help in the calculations, it takes about an hour to do one month. Once you get the hang of it though you should be able to do one year in about 2 days. And of course you can go as far as you want into the future as you want, data availability permitting. The heliocentric ephemeris I use is the one published each year by the U.S. Naval Observatory called the Astronomical Almanac (called the American Ephemeris and Nautical Almanac prior to 1981). Most university and public libraries should carry it in the government documents department. There are sources for heliocentric data further out than one year, probably at a local astrology book store. And there are many online sources for this data, some provided in the Links section.
Figuring the cycles
The first thing to do is get the Astronomical Almanac (for longitude data online visit: https://ssd.jpl.nasa.gov/tc.cgi#top. Here, I'll do the time discussed previously--January 11 to January 17, 1973. I always like to copy the pages I need rather than use the whole book. It's much easier working with separate pages than a whole book, especially since you often have to shuffle from page to page.
The Julian Date is a scientific number denoting the date. Latitude is not used. Latitude refers to the degrees the planet is north or south of the solar equator. Radius Vector, Orbital Longitude, and Daily Motion are also not used. We only use Longitude.
First we calculate and plot all the planet cycles except Mercury. Mercury is done separately because it moves so fast and would cause chaos if we added it with all the other planets together. Listed below are each of the planet cycle relationships we'll now calculate and plot. I suggest scratching them off as they're done. This is important so you don't forget what you've already done:
Venus-Earth Earth-Mars Mars-Jupiter Jupiter-Saturn Saturn-Uranus
Venus-Mars Earth-Jupiter Mars-Saturn Jupiter-Uranus Saturn-Neptune
Venus-Jupiter Earth-Saturn Mars-Uranus Jupiter-Neptune Saturn-Pluto
Venus-Saturn Earth-Uranus Mars-Neptune Jupiter-Pluto
Venus-Uranus Earth-Neptune Mars-Pluto Uranus-Neptune
Venus-Neptune Earth-Pluto Uranus-Pluto
Venus-Pluto Neptune-Pluto
There are 28 cycles here. Mercury will add another 8 making a total of 36 cycles in all.
First make a graph with the horizontal 'x' axis divided into six equal sections for Jan 11-17. The vertical 'y' axis should be divided into 180 degrees with 180 at the top. Graph paper should be used that has enough horizontal lines to represent each of the 180 degrees. The paper should be large enough to be able to distinguish 180 vertical points, which might mean a sheet of a size substantially larger than 8 1/2 x 11. The size depends on what kind of graph paper you find available. However, the larger the better. The larger it is the easier it will be to work with and see what you're doing. You'll also need a mechanical pencil with thin lead, the thinner the better (I use .5mm) and a metal straight-edge. Wooden rulers get dirty and their edge wears out.
Drawing the cycles
The difference between Venus and Earth longitudes (238.9 minus 110.6) is 128.3 degrees. So on the graph we'll place a reference dot on Jan 11 at 128.3 degrees. We do this calculation for each day for Venus-Earth and get seven dots. Connect the dots. That line is the cycle line representing the heliocentric longitudinal distance between Venus and Earth for the period.
This same process is then done for each of the remaining 27 planetary cycles listed above. So next find the difference between Venus and Mars longitudes for each day. Then plot those values on your chart and connect the dots.
There are certain "rules of the road" to observe while doing the calculations:
*If you subtract two of the longitudes of the planets and you get a number greater than 180, subtract that number from 360 to get the right number to plot.
*If you subtract two of the longitudes of the planets and you get a number less than 0 but greater than -180, multiply that number by -1 to make it positive.
*If you subtract two of the longitudes of the planets and you get a negative number less than 180, add 360 to get the right number to plot.
Simply put, the product of subtraction of two longitudes should always be between 0 and 180 for plotting.
Now Mercury has to be done, on a new graph. The 8 cycles for Mercury are:
Mercury-Venus Mercury-Jupiter Mercury-Neptune
Mercury-Earth Mercury-Saturn Mercury-Pluto
Mercury-Mars Mercury-Uranus
When the graph is finished you should have eight lines drawn.
Counting the Intersections
This is the fastest, simplest, and most rewarding part of the project. As you count the intersections you'll start to see how planetary angle harmonics take form. You'll now be, essentially, seeing into the future. In front of you will be an indicator which will tell you when the coming weather and stock market reversals will occur, when hurricanes will be generated, when an El Nino will occur, when wars are likely. You're now seeing the future tides of nature unfolding with cold scientific exactness, measurement, and calculation. You're now doing what innumerable cultures have crudely been doing since man first walked the earth and attempted to measure time and the seasons. I kinda laught to myself when I think 'what else did they have to do at night'?
This is the new Macro Astrology . . . the forecasting of weather and atmospheric system movements, times of geological disturbances, peculiarities of human and animal behavior, even times when viruses and bacteria are more active and abundant. Down through time, astrologers have satisfied themselves with following only six, ten, or maybe twenty planetary alignments in their work. Here you are looking at all possible planetary angle harmonics which is able to forecast the ebb and flow of all natural phenomena.
You've probably noticed by now that there are times in the charts when all the cycles converge at one time. These are times of strong planetary harmonics. What we simply do now is count the number of intersections between the lines that occur each day, that is, the number of times any two cycle lines cross during each day. Make a simple bar chart, divided into each day, and add up the number of intersections occurring each day.
We'll start with the 28-cycle sheet. On Jan 11 there was 1 intersection made. So on your graph paper make a bar chart indicating 1 for Jan 11. On Jan 12 there were 0 intersections, so leave Jan 12 blank on your bar chart. On Jan 13 there were 0 intersections. On Jan 14 there were 11 intersections, so put a bar line 11 high for Jan 14 on your bar chart. On Jan 15 there was 1 intersection. On Jan 16 there were 3 intersections.
You probably want to know how I counted the intersections when four cycle lines came together all at once on Jan 14. There are "laws of intersection". Two cycle lines coming together can only make one intersection, obviously. Three cycle lines coming together make three intersections. However, four cycles coming together make six intersections and five cycles together make ten intersections. So when four of the cycles came together on the 14th, six intersections were made.
Now we add the Mercury intersections to this bar chart. Based on the 8 Mercury Cycles Graph, Jan 11 has one intersection and Jan 15 has one intersection. Done.
This is the complete Berg Timer Methodology.
The Whole Earth Forecaster newsletter began in 1981, starting the long road to discovery. It was through the newsletter that I first presented most of the analysis and correlations now provided on the website www.justgoodtiming.com. I continue to add to my findings on the website. There is no end to this work. Like I said, it's like having a tiger by the tail.
Conclusions
The Berg Timer Method appears to best forecast those indices related to major atmospheric circulation like El Nino, wind, temperature, precipitation, and cyclones/hurricanes. Other things include tornadoes, health, Earth atmosphere, magnetic indices, cloudiness, air quality, ozone strength, and earthquakes. All these things, of course, have their individual idiosyncrasies. I remember as a child just sitting in my backyard, that all the living things, trees, insects, plants, have their own time responses to the environment. Aside from the obvious effects of the seasons, I believed then, and I know now, that there is a universal force, or "unforce", that is the impulse to which all living things, and their environment, react. And they can all now be predicted by the Berg Timer. But you have to investigate how all these things react to this timing within the context of their environment. That's where the research comes in and the development of the Profile of an indice. You can read about the BT Profile on the home page.
Admissions to psychiatric hospitals are higher on signal days. My family calls them signal days. But I haven't studied admissions to hospitals in general (data is very difficult to obtain). Air quality refers to particulates, sulphur oxides, carbon monoxide, nitrogen oxides, and lead. I haven't studied this area thoroughly, although I have studied ozone and found it to be very much related to BT. Since air quality is, to a great extent, dependent on weather, the other indices may very well show similar fluctuations.
Major earthquakes are forecasted by BT too. Since global angular momentum has to be preserved, science now understands that the up and down of the angular momentum of the atmosphere has an opposite effect upon the anglar momentum of the solid earth, causing seismic activity. If this is the case, BT's correlation to seismicity is now understood. It's interesting to note here that the scientific method of calculating the length of day (in milliseconds) by using very-long-base interferometry correlates well with BT. They put instruments in various parts of the world, and reference Earth's position with respect to fixed star positions. This way they're able to calculate the length of day in milliseconds. The variation in length of day is caused by the tug and push of the atmosphere upon the earth's rotation. Since BT is able to forecast atmospheric changes due to solar activity it can forecast changes in atmospheric, oceanic, and Earth body angular momentum.
Reflections
Throughout my 45+ years of studying planetary positions and their effects upon the sun and Earth, one thing has stood out, the scientific community's reluctance to accept anything related to planetary positions. This is a deep-seated prejudice going way back to the origins of present day astronomy. Originally, astronomy and astrology were one. Astronomy de-linked itself from astrology when astrology became "popularized" and unscientific. But, in doing so, astronomy also de-linked itself from a basic truth, that planetary positions affect things. Many current astrological beliefs are false, in my opinion, as discussed previously. However, my work has empirically proven that planetary motions DO affect Earth's weather, geophysics and biosphere, a notion now blasphemous to most scientists simply because it sounds like astrology. I'm not here to get on the pulpit and preach about the goodness of astrology. But I'm afraid that most all scientists have thrown the baby out with the bath water. Some scientists even say that the sun does not affect Earth's weather. Can you believe that? I know. This is how far much of science has turned its back on the natural cycles all around us.
However, the astrological truth is still managing to find its way into science. I prefer to call it a new astronomical truth. Some scientists claim to have found, empirically, that the gravitational forces of the planets affect solar activity. Others claim that it's electromagnetic. Whatever the mechanism, the science for planetary positions affecting us will eventually be proven. It will be a new science, new physics. It's only a matter of time. The astronomical community will react, vehemently at first, to this new science, as scientists react to all new science.
Scientists who ignore or refuse to accept it will be left behind. The only future for astronomy is to work with the truth that planetary motions affect us. Astronomers should be trying to figure out why it works instead of hiding their heads in the sand and ignoring it. Ignoring it won't make it any less true.
Their are many possible areas for further study and application of the Berg Timer. The largest problem now facing us is not whether or not there is evidence for its usefulness. I have shown that BT correlates well with many things, especially solar flares and El Nino. The problem is getting over the hump of equating my work with astrology. My work is not astrology. It is cold, hard scientific data, presented as Nature intended. The motions of the planets are God's symphony. His music. Understanding the notes of Nature's music is the business of science.
There is no exact cause/effect proof to account for BT's effect, with the science we now have. I don't think we have the instruments necessary to monitor the 'power' that these planetary motions represent. Maybe it will be when we put out space buoys so we can monitor the interplanetary magnetic field everywhere out there.
It's my opinion that the final discovery of BT's effect will be very simple. As we wait for 'the discovery', we can work on some other things to overcome. For instance . . .
I do see a day when The Berg Timer will be proven because I know it works. In centuries to come, when we venture out to other solar systems, the Berg Timer can be applied to each solar system. If those systems' planetary harmonics also coincide with that system's solar activity and terrestrial weather, a conclusive case can be made that the Berg Timer works. Already I have made convincing cases for the Berg Timer's extraterrestrial effect on Moonquakes and Mars weather. As we explore all our planets, we'll find that they all share the same timing of their weather systems and seismicity. What a beautifully organized and tuned universe it is in which we live! I have empirically proven that BT is probably a primary cause of all planets' weather. It's a new physics. But, really, it's just a modernization of that which our oldest ancestors already knew. Our awareness of the broad application of BT will only grow with time. The evidence will only get better as we explore every planet and other solar systems.
There has been proof for planets around other stars in our galaxy. It'll be interesting when we find out what the average planet count is for a solar system. According to the Berg Timer Method, if a solar system has only two or three planets, that system's solar and terrestrial weather will be relatively quiet, compared to a system with nine planets like ours.
Even though other solar systems are within reach, we all know that star exploration is a long way off. However, someday, like the old man's telescope next door, the Berg Timer Method will motivate some young explorer to prove that, yes indeed, the Berg Timer isn't just a name, it's the key to the universe.
The Beginning
My Work in The Bible Code
I watched with fascination the television series called The Bible Code, mostly on The History Channel and The Discovery Channel. You may have seen it too.
The Bible Code is a computer analysis of hidden words in the Bible. By skipping a certain number of letters, it is possible to find clusters of words describing events and persons in history (and the future), clusters which defy chance probabilities of those words occurring together. Their analysis yielded historical findings concerning the World Wars, Hitler, Bin Laden, Israeli history, Popes, etc.. The Bible Code technique was successfully used to forecast that the Israeli prime minister would be assassinated. The warning went unheaded and the prediction occurred as forecasted.
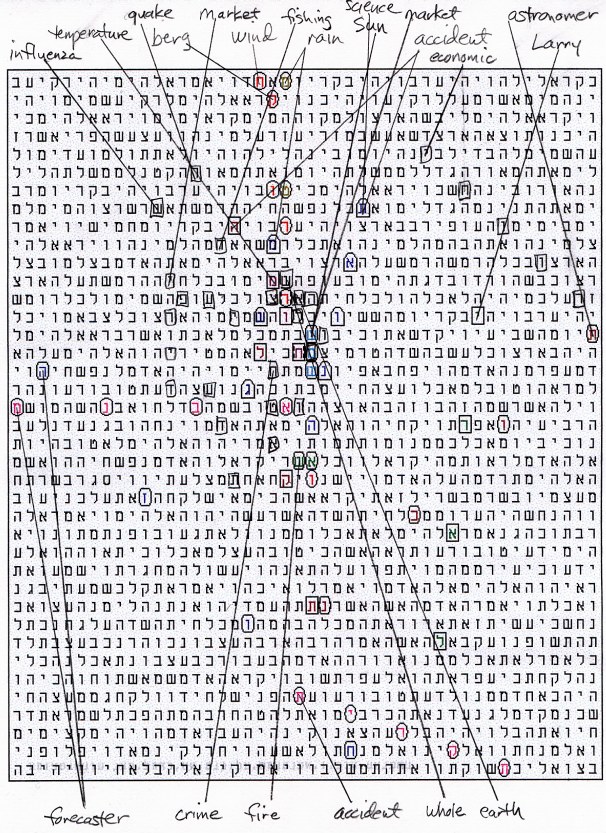
Who could skip the chance to see if ones own life or work is in the Bible? So I bought a Bible Code extracting program on the internet and below is what I found. Using the original Torah Old Testament I made searches for words that apply to my work (I don't know Hebrew, the program translates it for you). I was quite startled with what I found. Below is shown the matrix.
Between Genesis 1:5 and Genesis 4:8 is a strong clustering of relevant words to my name and work. In the exact middle, of course, is "sun". Immediately surrounding and intersecting "sun" is "market", "science", "whole" and "earth". The professional Bible Code analyzers say that words high in the matrix, close together and crossing words, are the most significant. You can see below the strong clustering of words around the middle word "sun". "Larry" is crossed by "astronomer". The word "berg" is in the second row, one of the three highest words, the other two being "rain" and "wind", which interestingly enough, are among the most reliable indices which the Berg Timer is able to forecast. The words "whole" and "earth" cross and are placed just above "sun".
It's also interesting that "sun" and "earth" are the only words that occur without a skip. Also, the middle letter of the word "sun" and the last letter of "berg" are touching and both "sun" and "berg" occur in the exact center from left to right.
Not shown are other words I've found later, like Jupiter, Saturn, flare, lightning and scientist. I don't know what the probability is of this congruence of words. I take it as being meaningful since many Bible scholars have concluded this to be reliable.
Most interesting to me is the fact that my favorite quote from the Bible is enclosed in my matrix, a quote which I inserted in my first Berg Timer method booklet published in 1981, long before I or anyone else knew anything about the Bible Code. That quote is:
"And God said: 'Let there be lights in the firmament of the heaven to divide the day from the night; and let them be for signs, and for seasons, and for days and years.'"
Genesis 1:14.