ECONOMICS
|
WEATHER
|
BEHAVIOR
|
NATURAL DISASTERS
|
ENVIRONMENT
|
HEALTH
|
||
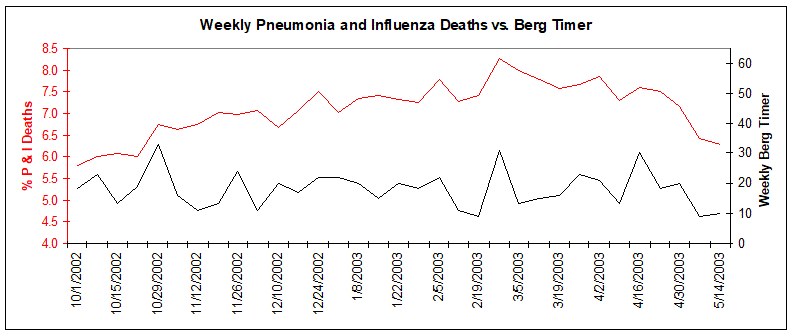
Hospital Admittance
|
|||||||
|
|
|
 |
 |
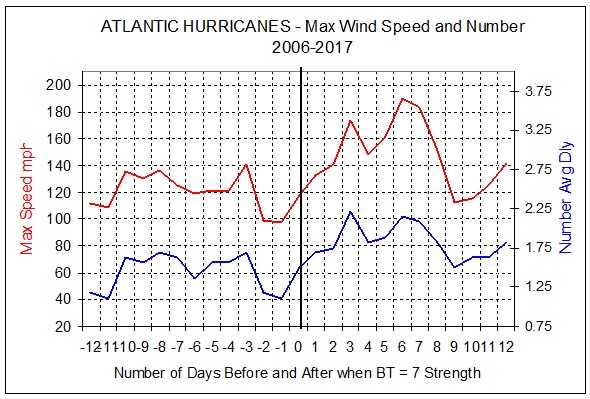 |
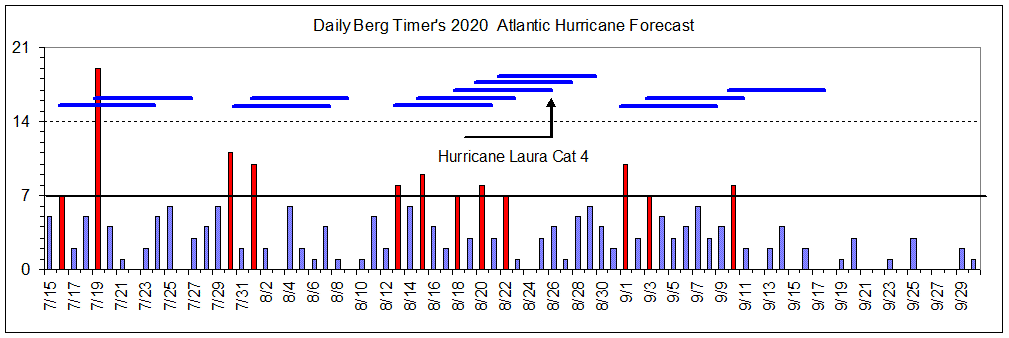
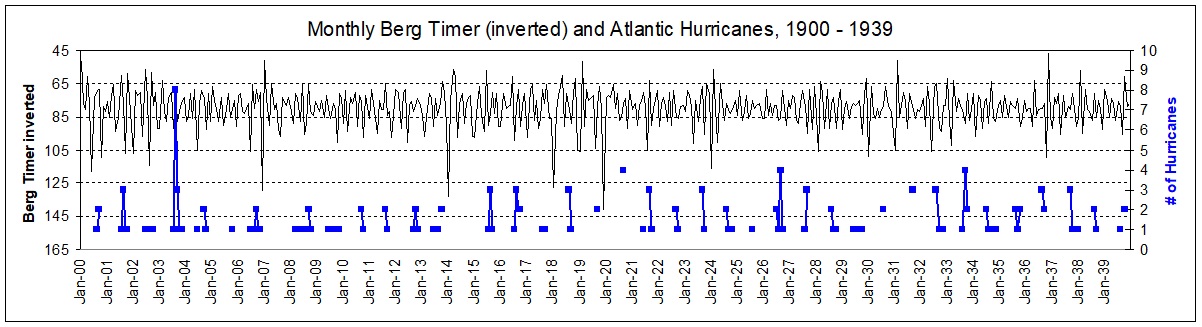
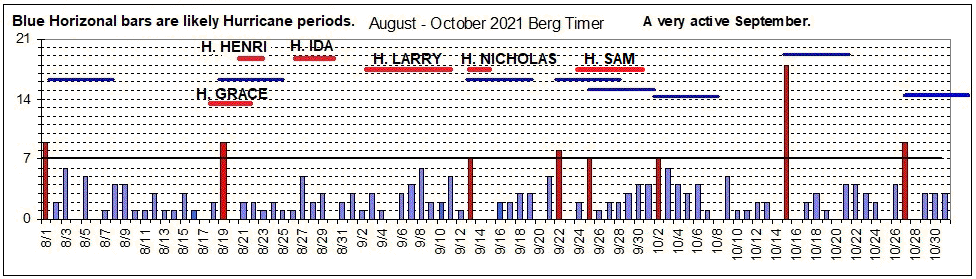
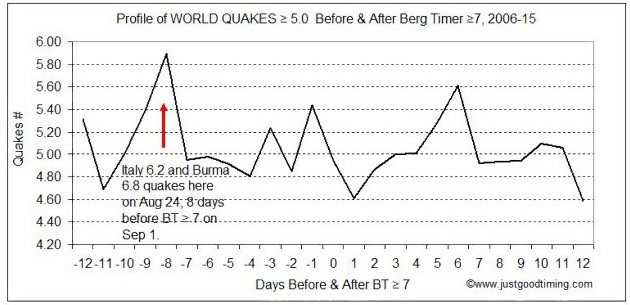
Atlantic Hurricanes during 2006 to 2017
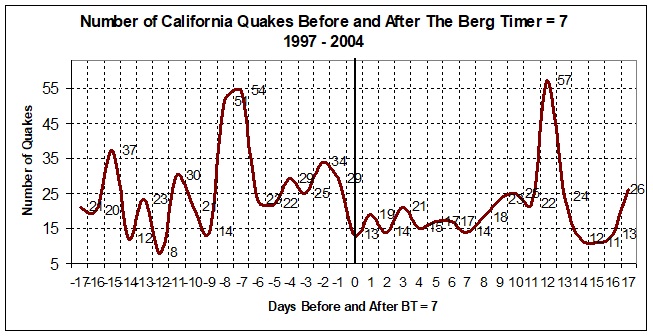
The hurricane study done in 2004 is still available on the Natural Disasters page. That covered the period of 1999 to 2004.
It found that hurricanes started forming when the Berg Timer was '5' strength or more and that their maximum wind strength occurred within 8 days after that.
Those findings hold up with these new profiles.
Hurricanes are least likely before day '0' (which is when BT >6 strength) and most likely after '0'. The same goes for wind speed.
|
 |
 |
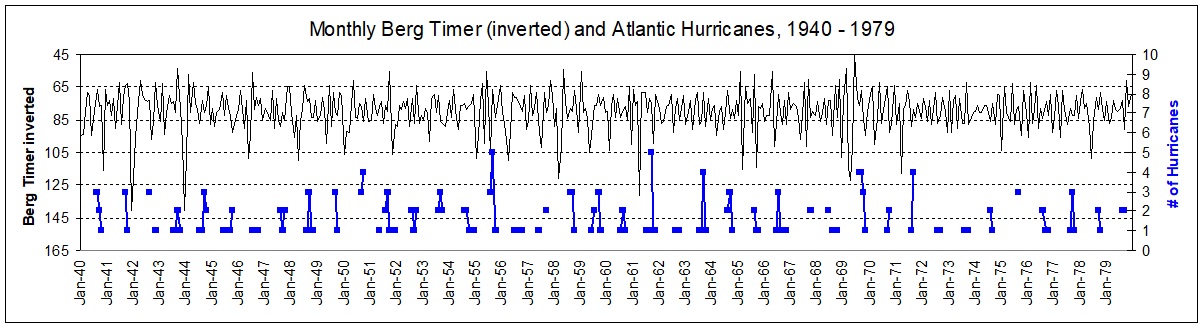
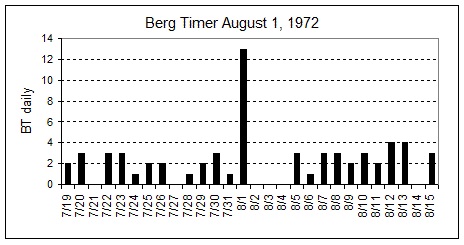 The Berg Timer and the Solar Storm of August 1972
The powerful solar storms of early August 1972 were intense solar flares and particle events with major geomagnetic storms.
|
Flares were first reported August 2. Radio and satellite blackouts started immediately.
An August 4 flare was among the largest documented in history generating X-ray emissions above background level for more than 16 hours.
The geomagnetic storm caused widespread electrical grid and satellite disturbances throughout Canada and North America, the Phillipines, Brazil, and Japan. As many as 4,000 naval mines exploded in Haiphong Vietnam.
Navy investigators at the NOAA Space Environment Center confirmed that the geomagnetic intensity was enough to cause such explosions.
Regardless of location, some astronauts without complete shielding or moonwalkers would have faced certain death due to the radiation, cancer being unavoidable.
|
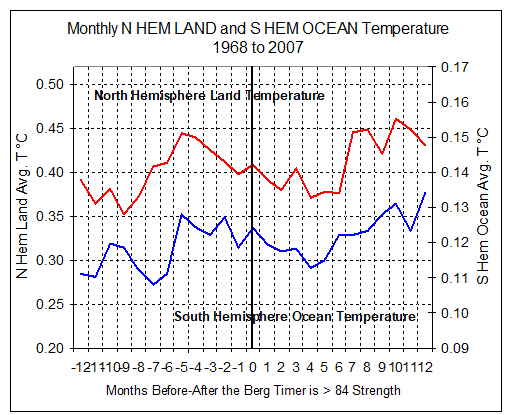
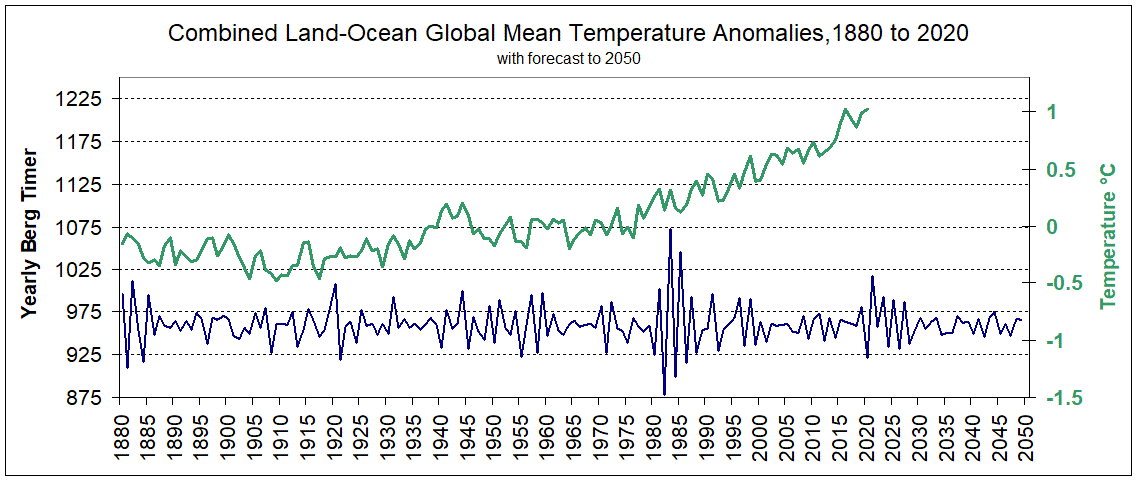
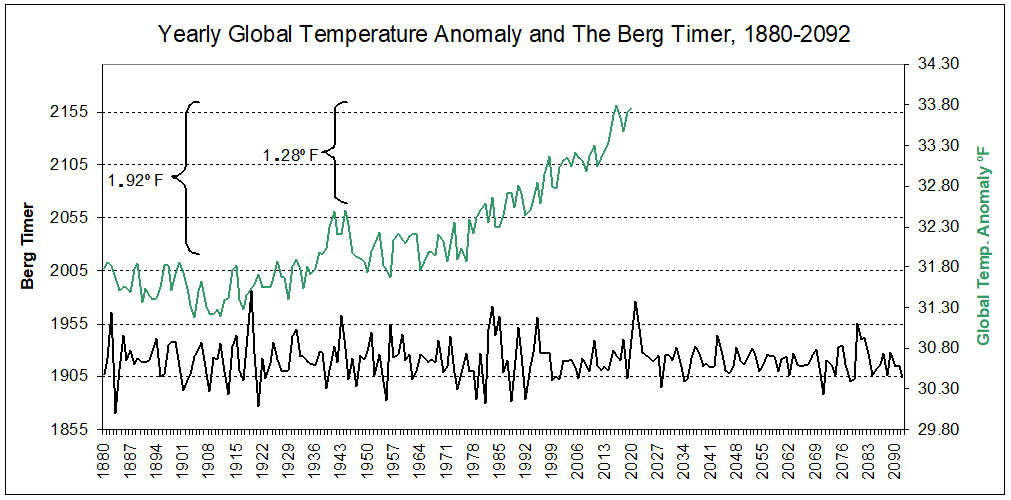
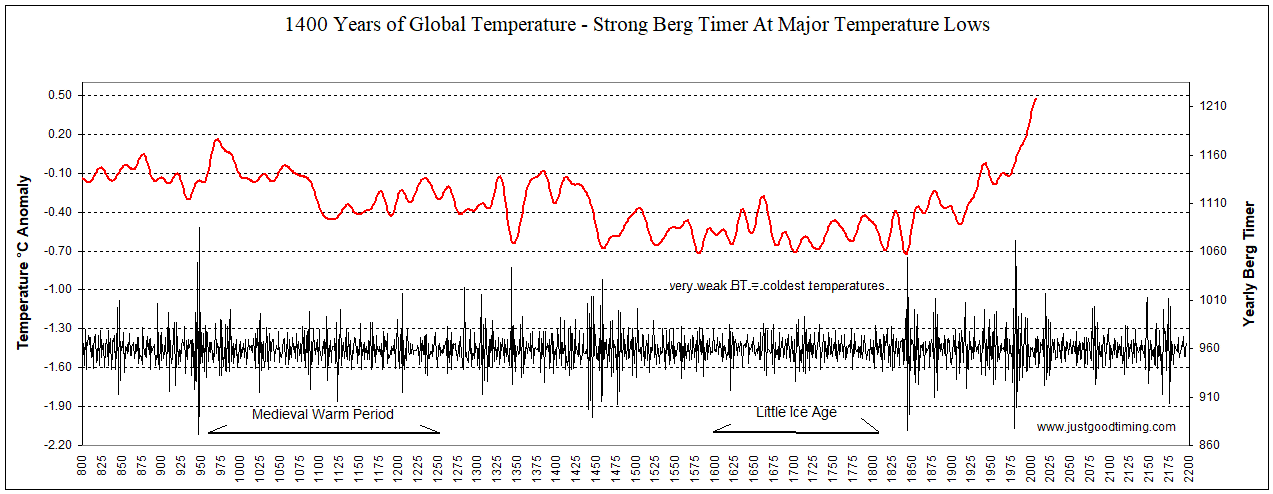 Temperature data source: http://www.meteo.psu.edu/holocene/public_html/supplements/MultiproxyMeans07/ (directly to data: data). Updated: data

 |
 |
 |
 |
 |
 |
 |
 |
 |
 |
 |
 |


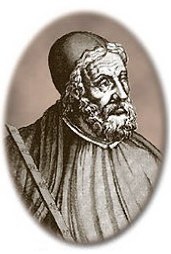 CLADIUS PTOLEMY
AD 100 - 168
Alexandria, Egypt
|
 GALILEO GALILEI
1564 - 1642
Pisa, Italy
|
 JOHANNES KEPLER
1571 - 1630
Stuttgart, Germany
|
 SIR ISAAC NEWTON
1642 - 1726
Lincolnshire, England
|
 ALBERT EINSTEIN
1879 - 1955
Ulm, Germany
|
. . . only
mathematics can provide sure and unshakable knowledge to its devotees, provided one
approaches it rigorously. For its kind of proof proceeds by indisputable methods, namely
arithmetic and geometry
|
In questions of science, the authority of a thousand is not worth the humble reasoning of a single individual.
|
I much prefer the sharpest criticism of a single intelligent man to the thoughtless approval of the masses.
The roads by which men arrive at their insights into celestial matters seem to me almost as worthy of wonder as those matters in themselves.
|
The same thing is to be understood of all bodies, revolved in any orbits. They all endeavour to recede from the centres of their orbits, and were it not for the opposition of a contrary force which restrains them to and detains them in their orbits, which I therefore call Centripetal, would fly off in right lines with a uniform motion.
|
The grand aim of all science is to cover the greatest number of empirical facts by logical deduction from the smallest number of hypotheses or axioms.
|
Ptolemy's Almagest was an authoritative text on astronomy for more than a thousand years, and the Tetrabiblos, its companion volume, was influential in the study of the effects of astronomical cycles on earthly matters.
|
Galileo was one of the first modern thinkers to clearly state that the laws of nature are mathematical.
|
Kepler's three laws of planetary motion around the sun correctly replaced Copernicus' heliocentric orbits with elliptical trajectories, two of the laws being that planets move in ellipses with the Sun at one focus and a planet sweeps out equal areas in equal times.
|
In Principia, Isaac Newton formulated the laws of motion and universal gravitation that formed the dominant scientific viewpoint until it was superseded by Einstein's theory of relativity.
|
Albert Einstein was the developer of the theory of relativity, one of the two pillars of modern physics (alongside quantum mechanics).
|


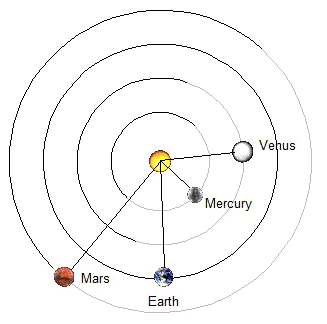
Interior Planets' Positions, June 23-25,
1982
 |
The Three Ways a Berg Timer Point Can Be Made
|
 Symmetricity
    |
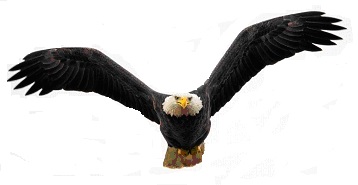
No. 1
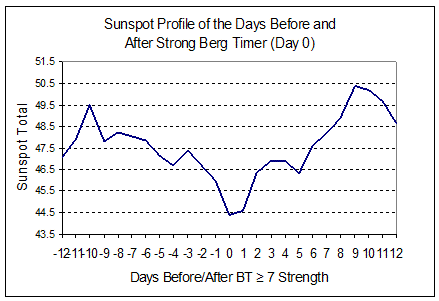
~ SUNSPOTS ~
"The Eagle"
What a wonderfully symmetrical profile!
Nature's a beautiful thing. The profile of
the first cause appropriately flying like an eagle.
The Sun-Earth effect begins here.
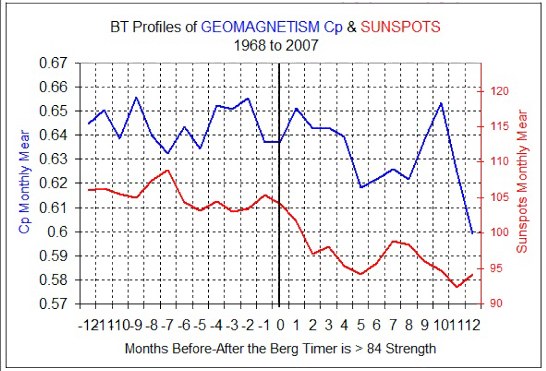
When the nine planets are in a highly symmetrical position, which is day '0', solar activity is very low. This fact unleashed my torrent of research and evidence for this, perhaps, new law of physics.
Sunspots are areas on the sun which usually have opposite magnetic polarity and cooler temperature. There are fewest sunspots occurring exactly at day '0', when BT is at its strongest, what I call,
'at the beak'.
sunspot data source:
|
No. 1a
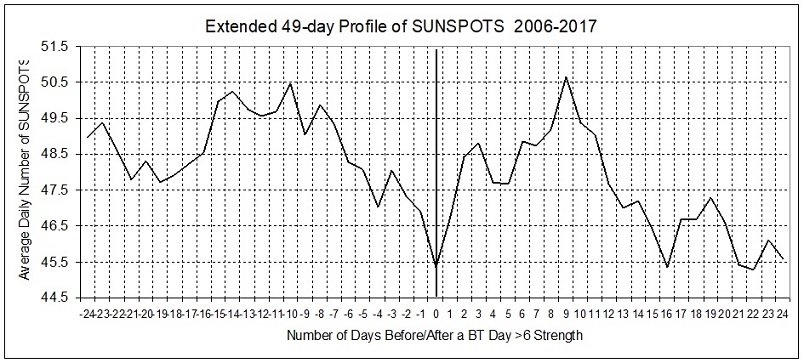
~ SUNSPOTS Extended ~
Below is the latest Sunspot Profile, extended out to 24 days on both sides. It provides an even more interesting look at the symmetry of the profile of "The Eagle's wings", and making for a longer-term forecasting tool for the solar scientists.
 |
|
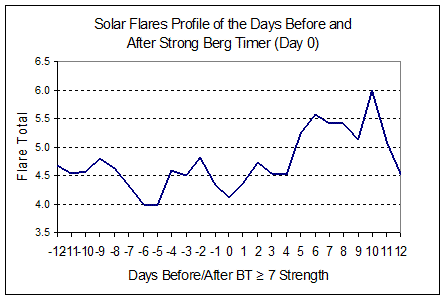  |
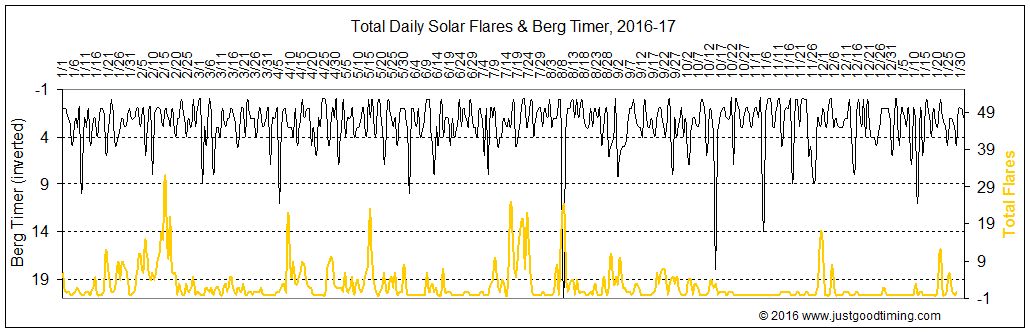
No. 2
~ SOLAR FLARES ~
Solar flares often coincide with sunspots. Flares bottom with sunspots at day "0" when BT >= 7 strength.
The physics of the planetary positions' effect is not known. I believe it to be an effect of the planetary positions, as represented by the Berg Timer, on the solar system's interplanetary magnetic field.
What a big surge of activity after '0' day!
|
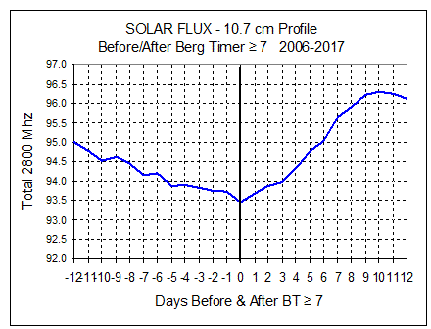  |
No. 3
~ SOLAR FLUX ~
Solar flux is radio emission from the sun. It originates high in the sun's chromosphere.
Flux bottoms exactly at the eagle's beak when BT is strongest and solar activity is lowest.
"The solar radio flux at 10.7 cm is an excellent indicator of solar activity. It is one of the longest running records of solar activity . . . it correlates well with the sunspot number as well as a number of UltraViolet (UV), ozone, and solar irradiance emissions that impact the (Earth) ionosphere and stratosphere." From link below.
|
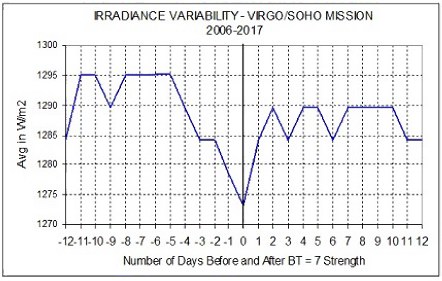  |
No. 4
~ SOLAR IRRADIANCE satellite ~
Solar irradiance is one of the most fundamental drivers of Earth weather and long-term climate.
Satellites provide the most accurate solar irradiance data. Strong BT = low solar activity and low irradiance.
This data is from the VIRGO/SOHO mission and the Physical-Meteorological Observatory Davos/World Radiation Center.
Again, exactly 'at the beak'.
|
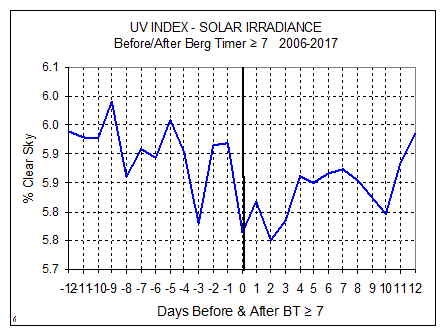 |
No. 5
~ SOLAR IRRADIANCE ground ~
This chart shows total sunshine received at ground level. At day '0' to day '2', sky is least clear. Clouds are blocking the sun's radiation. So not only is there less sunshine then (4 above) but there is also more cloud cover generated by the ionized atmosphere. Less sunshine, cooler Earth.
More on Irradiance at the links below.
|
 Long-Term Cosmic Rays and Cloud Cover
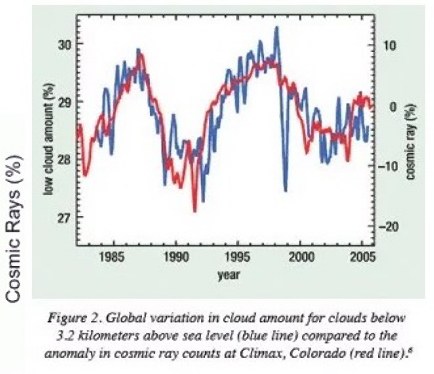 The chart above is evidence supporting correlation between cosmic rays and clouding.
|
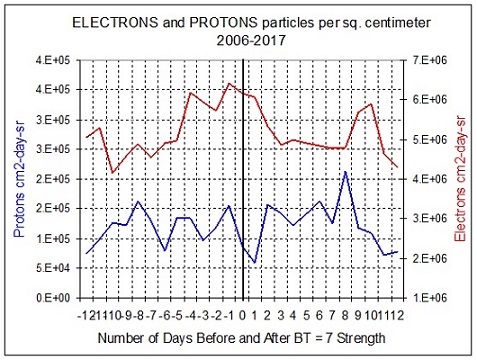
No. 6
~ COSMIC RAYS and CLOUDS~
Electrons and Protons
Low solar activity weakens Earth's magnetic field. The weak field lets in more cosmic ray particles, mostly protons and electrons.
When the protons and electrons enter the atmosphere they slam into other particles. They lose an electron and become charged ionized particles.
Water vapor attaches itself to the ionized particles, a process called nucleation which eventually forms clouds.
When BT is strong, solar activity bottoms and Earth's magnetic field is at its weakest, allowing the particles in.
Which ion is most responsible for nucleation, protons or electrons?
The responsible ion's count must be high at day '0' when all this is happening.
To the left is charted proton and electron flux with respect to when the Berg Timer is strongest at day '0'.
Protons bottom at day '1' right after day '0'.
But electrons peak at day '0'. So it's highly likely that electrons are the stronger nucleating agent leading to cloud formation.
So, strong BT = low solar activity = high electrons = high cloud production = cooler Earth.
electron and proton data:
then click on the DPD files.
|
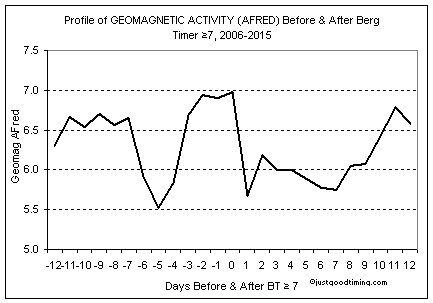
 geomagnetism data: https://www.swpc.noaa.gov/products/planetary-k-index
|
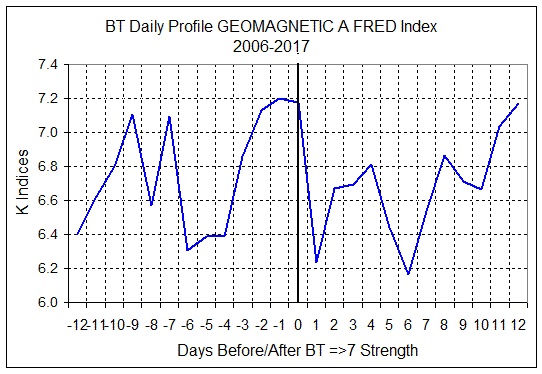
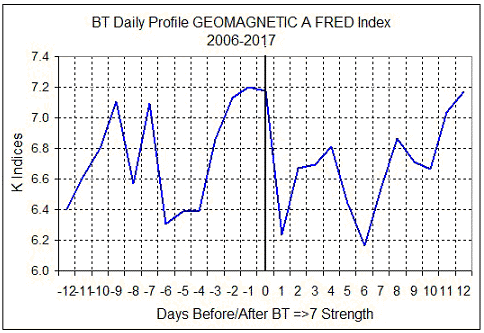
No. 6a
~ Geomagnetic Activity ~
Strong BT means fewer sunspots and solar flares, causing a weaker Earth magnetic field which allows cosmic particles to enter Earth's atmosphere causing increased ionization of the atmosphere and Earth, thus higher geomagnetism, its profile shown on the left. High geomagnetic activity can cause power surges and disruption in power lines, radio, satellite, telephone, and military early warning/detection/navigation, induced currents in pipelines, and radiation on aircraft and astronauts.
It can also disorient whales, birds, bees, and even microscopic bacteria.
|
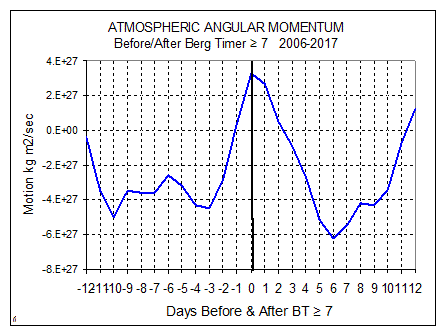 The AAM indice is defined as the ratio of East-West vs. North-South winds on Earth.
The atmosphere accounts for 80-90% of the total angular momentum of Earth. The oceans and solid body of Earth account for the other 10-20%.
 |
No. 7
~ ATMOSPHERIC ANGULAR MOMENTUM ~
This is a very strong profile, peaking at
'the Eagle's beak'.
Planetary positions as represented by the Berg Timer correlate positively with the atmospheric and wind changes defined by AAM. This is why BT is so accurate at forecasting El Nino and Monsoon.
The article below describes what scientists call the 3060-day "flip-flop oscillation" of our equator-to-pole atmospheric circulation as "not well understood" and that "the possible mechanism causing the poleward propagation is unknown".
The Berg Timer might be "the unknown" catalyst.
Angular Momentum data:
|
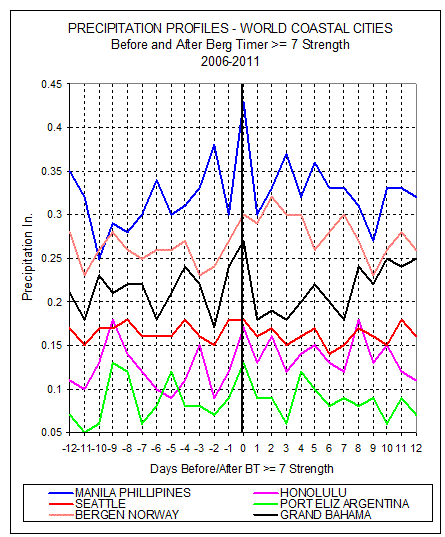 |
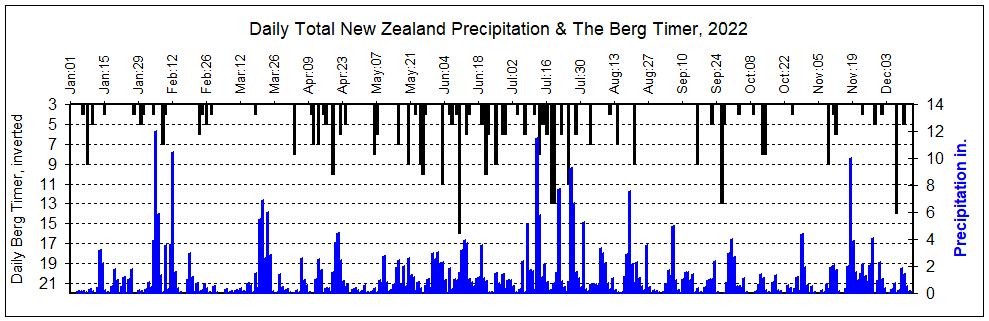
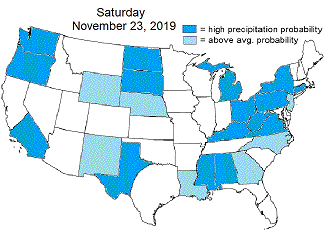
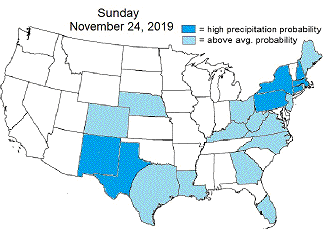
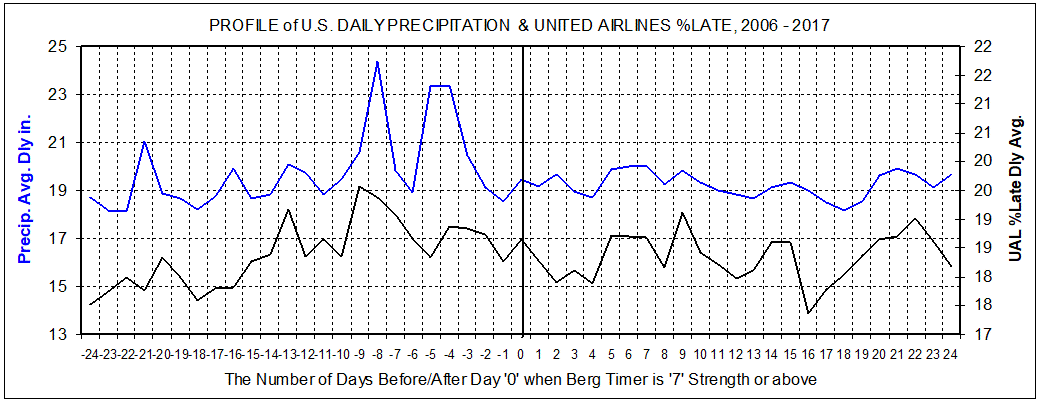
No. 8
~ PRECIPITATION - Coastal Cities ~
Ocean and coasts' weather have higher precipitation
when BT is strong.
So this 'peaks at the beak'.
The profiles are quite striking in their structure similarity at all world locations.
These things aren't occurring by chance.
Strong Berg Timer = low solar activity = high cosmic ray particles entering Earth's atmosphere = high cloud formation = high ocean precipitation.
data from NOAA World Climate Data
|
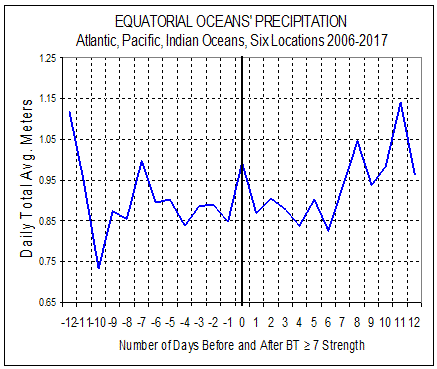 |
No. 9
~ OCEAN PRECIPITATION ~
Ocean precipitation peaks at "0".
Ocean and land precipitation are opposite.
See chart in No.10 next.
 |
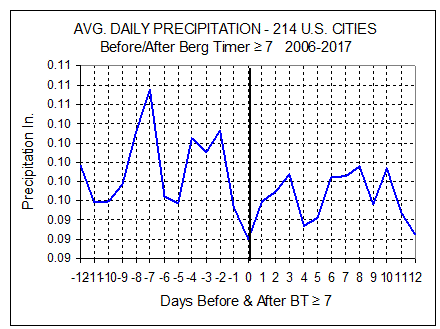 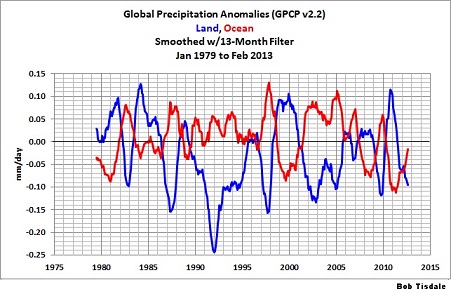 |
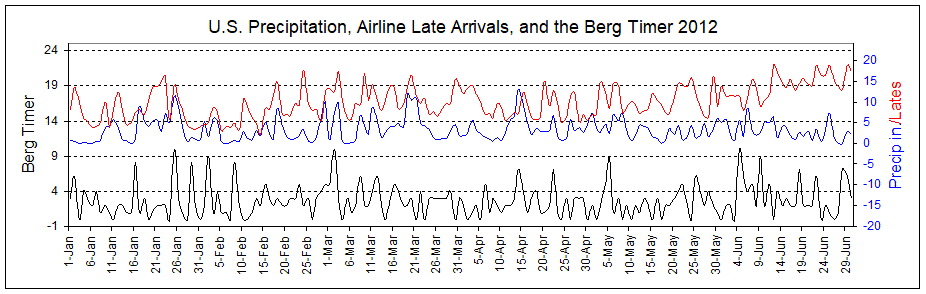
No. 10
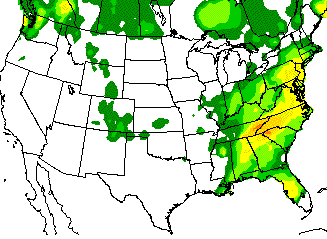
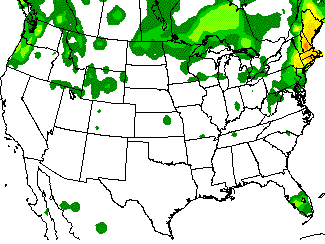
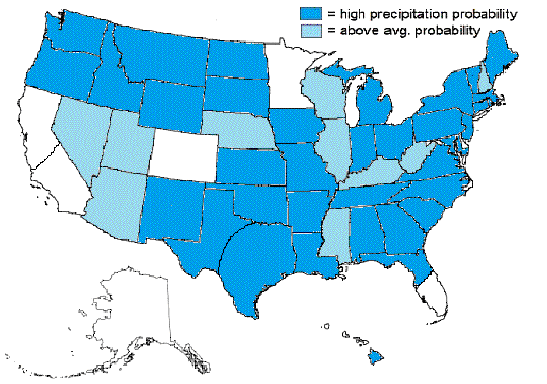
~ PRECIPITATION - Inland Cities ~
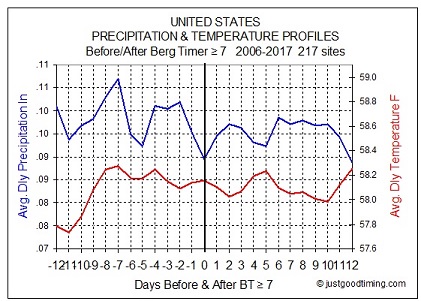
This left profile shows that the low of 214 inland U.S. cities' precipitation occurs exactly at day '0'.
Thus, land precipitation occurs oppositely to ocean precipitation which peak at day '0' (profiles in No. 8 and 9).
This correlation is confirmed by the Land/Ocean chart (lower left) showing long-term Land and Ocean precipitation moving oppositely.
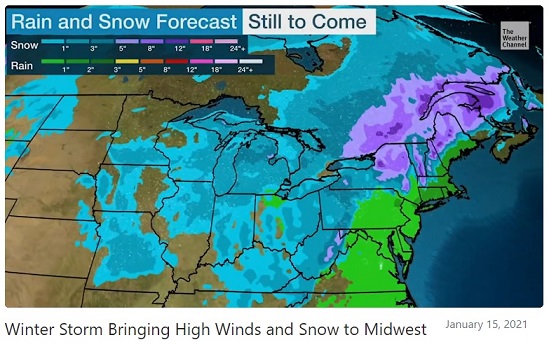
Being able to forecast rain is one of the first and most valuable discoveries my work produced. I remember growing up in the Midwest, watching the rain come and go with the Berg Timer. That's was my first confirmation of BT's worth.
The Great Plains are certainly great for weather watching. It gets most all the fronts that move out of the Rockies and up from the Gulf.
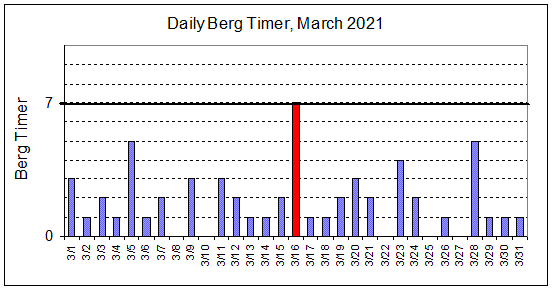
Day '0' is when BT is 7 or above strength. BT can forecast when it will most likely rain, wherever you are -- inland, coastal, or at sea. To find out the most likely times for rain, you would make a BT profile of the desired location's precipitation past behavior then use future BT with the profile to forecast the most likely times for precipitation. See how on this page.
|
  Sea Ice Extent data source:
|
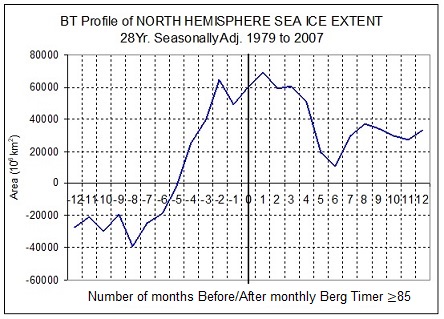
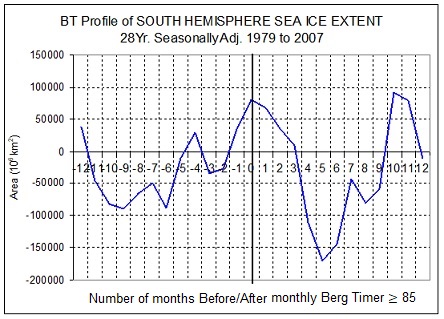
No. 11
~ GLOBAL SEA ICE EXTENT ~
Seasonally Adjusted
Note*
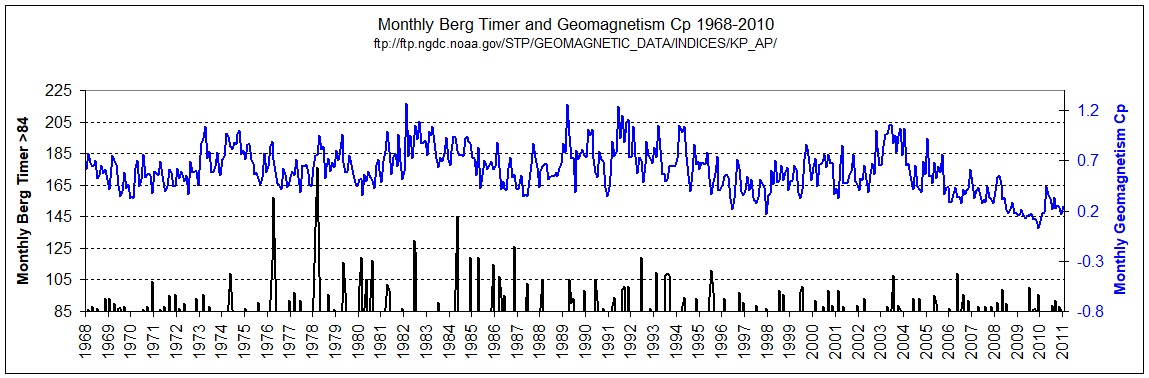
These are the first Monthly BT Profiles ever produced. Longer-term BT profiles provide a better understanding of both short and long-term weather indices.
The Berg Timer is able to forecast the long term up's and down's of sea ice because it's so good at forecasting longer-term weather.
This 25 year study of monthly BT found that both hemispheres' sea ice peaks within a month of strong BT, with trends lasting up to a year.
This is consistent with the 1400-year study on this page above.
Long term sea ice peaks and temperatures are low when BT is strong.
Strong BT = low solar activity = high nucleation of clouds = cooler Earth = more ice.
Here's a study long ago on Arctic Ice and monthly BT showing that
High BT = More Ice.
Nice confirmation from a past study.
|
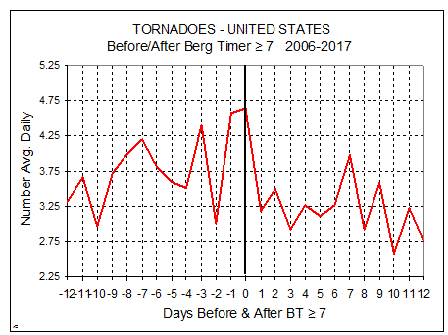  |
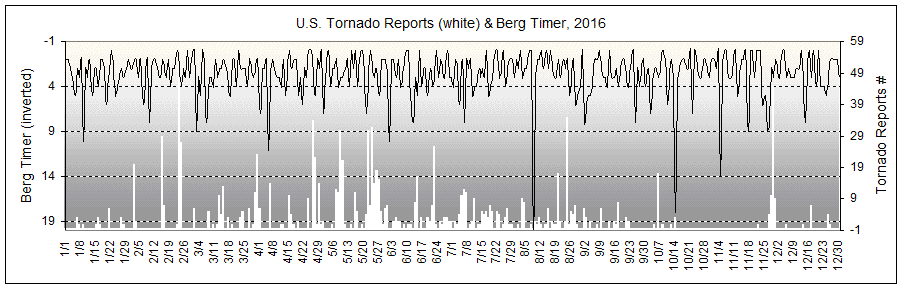
No. 12
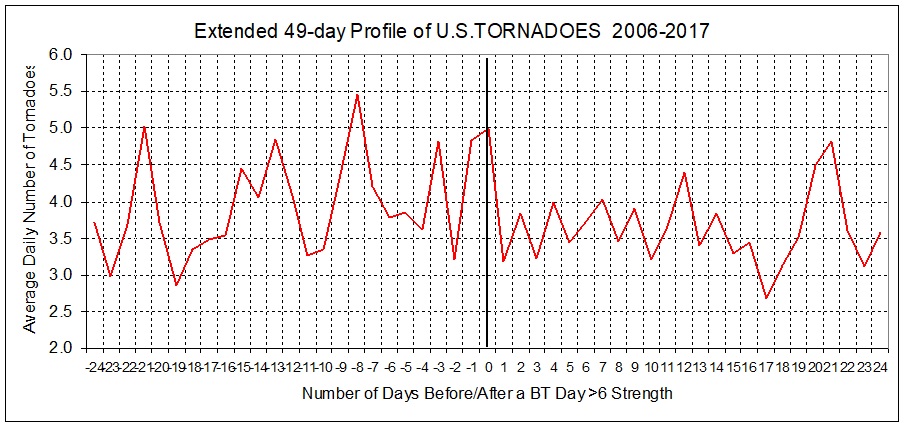
~ TORNADOES ~
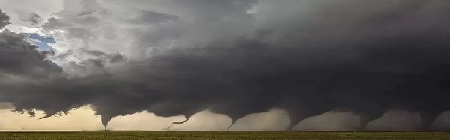
Tornadoes are most often the result of strong low pressure fronts that move out of the Rocky Mountains into middle America, pulling up warm air from the south which combines with the cool northern air to form strong updrafting, tornadoes in the central U.S. area known as 'tornado alley'.
The tornado profile is very strong and peaks exactly 'at the beak'.
Tornado data source:
Left, the evolution of a single tornado on
May 24, 2016 in Kansas.
|
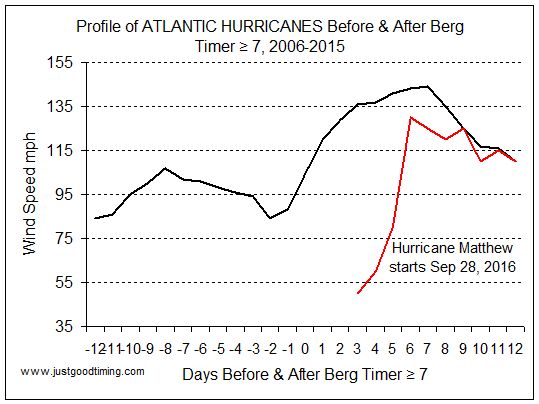 |
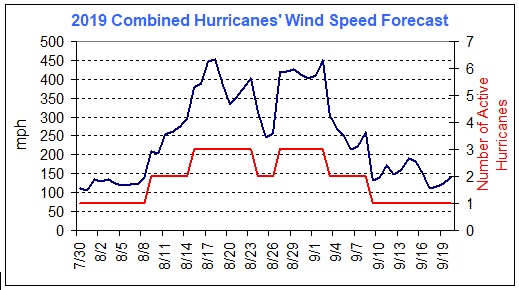
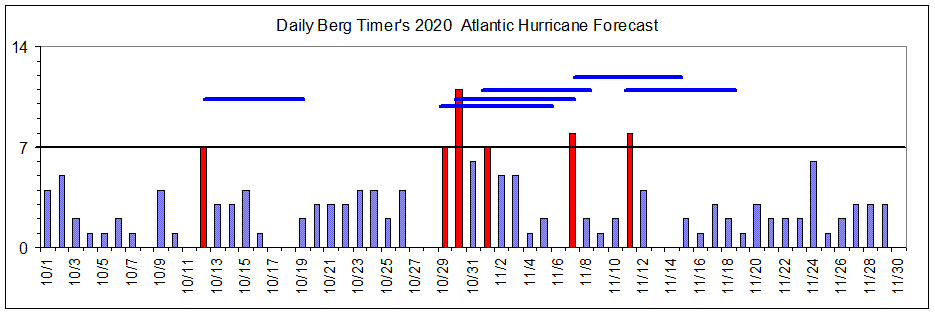
HURRICANE MATTHEW, 2016
Matthew was a natural progression of strength caused by the Berg Timer. It peaked in strength just one day before the profile forecast.
It caused hundreds of deaths in Haiti and much damage throughout the Bahamas and the eastern coast of Florida. South Carolina had massive flooding. BT again proves itself to be a reliable forecasting tool.
|
 |
 |


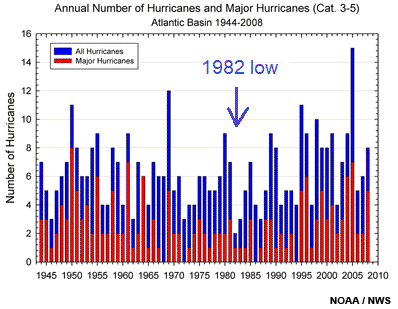 |
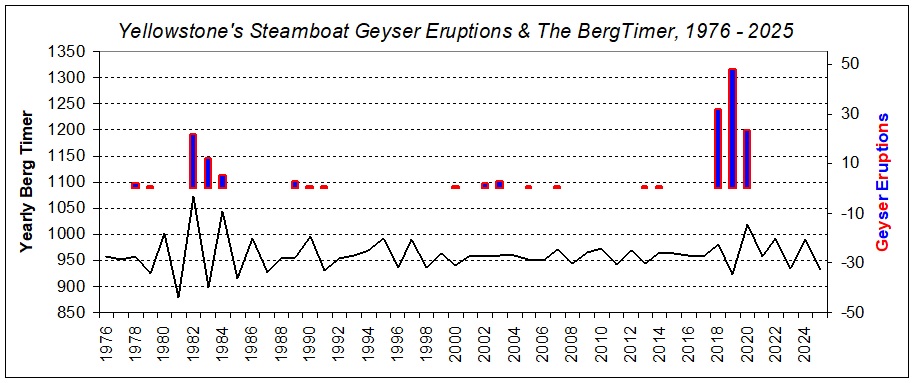
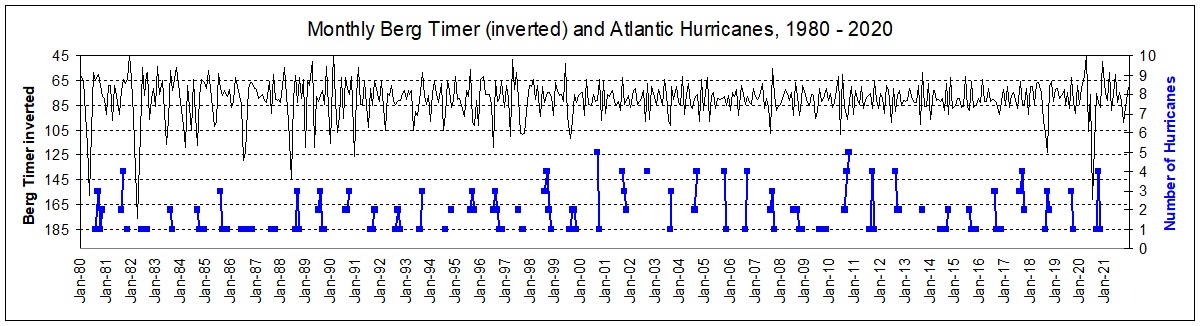
1982 - A Turning Point of Weather History
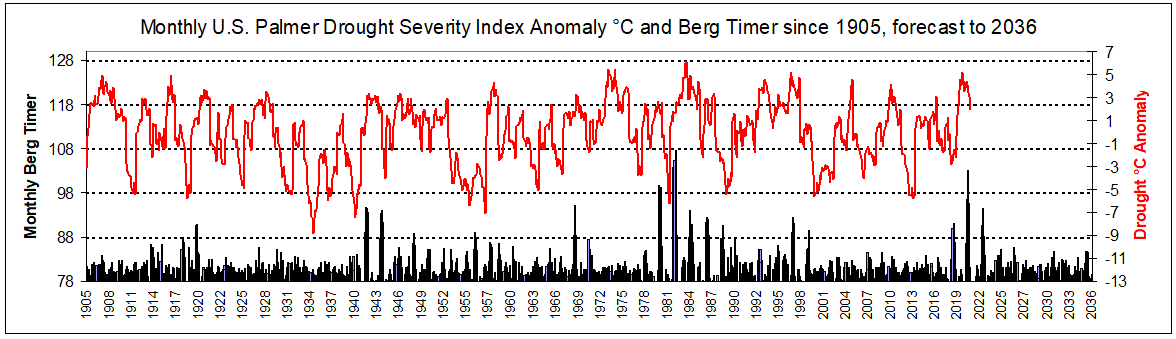
The number of hurricanes, like monthly temperature, bottomed in 1982.
In July of 1982, major solar flares caused what was termed 'an unusual' and 'interesting' solar-terrestrial event. It's detailed in the paper, "Structure of the July 1982 Event In Relation To the Magnetosphere's Response", published here at harvard.edu.
1982 BT also coincided with the strongest El Nino event in recorded history.
|
 What Symmetry! Quite the "
There are a couple theories out there to describe what's going on here to explain why the Berg Timer works. The best I think is the electromagnetic one, equating the solar system to a generator.
It's probably new physics. Or maybe just take away Pluto and you have Grandad's old V-8 motor.
|
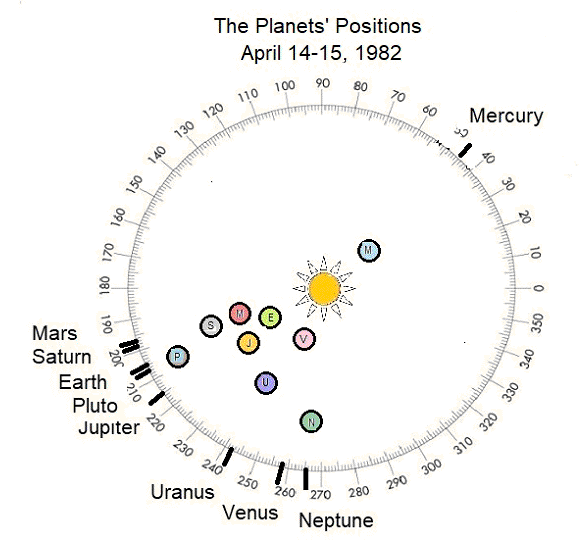
Heliocentric Longitudinal Relationships
All planets except Mercury were within 67 degrees of each other.
Earth and Pluto were conjunct, in the same degree of longitude with respect to the Sun. So Earth and Pluto were equal degrees away from the other 7 planets.
Mars and Saturn were also conjunct three days later.
These are the other multiple equal degree separations that occurred:
Venus was 7 degrees away from Neptune
Earth was 7 degrees from Saturn
Saturn was 7 degrees from Pluto
Earth was 8 degrees from both Mars and Jupiter
Mars was 8 degrees from Pluto
Venus was 16 degrees from Uranus
Jupiter was 16 degrees from Saturn
Mercury was equidistant from two or more planets fourteen times during its 10 degree movement from April 14 to 15.
 |
300 to 599
|
600 to 899
|
900 to 1199
|
1200 to 1499
|
1500 to 1799
|
1800 to 2100
|
|||||||||||
YEAR
|
BT
|
YEAR
|
BT
|
YEAR
|
BT
|
YEAR
|
BT
|
YEAR
|
BT
|
YEAR
|
BT
|
|||||
300
|
943
|
600
|
982
|
900
|
971
|
1200
|
990
|
1500
|
945
|
1800
|
955
|
|||||
301
|
970
|
601
|
949
|
901
|
977
|
1201
|
954
|
1501
|
972
|
1801
|
961
|
|||||
302
|
956
|
602
|
962
|
902
|
948
|
1202
|
953
|
1502
|
946
|
1802
|
946
|
|||||
303
|
956
|
603
|
951
|
903
|
964
|
1203
|
940
|
1503
|
930
|
1803
|
968
|
|||||
304
|
960
|
604
|
961
|
904
|
950
|
1204
|
975
|
1504
|
1002
|
1804
|
940
|
|||||
305
|
958
|
605
|
961
|
905
|
956
|
1205
|
945
|
1505
|
957
|
1805
|
984
|
|||||
306
|
959
|
606
|
956
|
906
|
971
|
1206
|
1017
|
1506
|
958
|
1806
|
959
|
|||||
307
|
945
|
607
|
965
|
907
|
972
|
1207
|
915
|
1507
|
957
|
1807
|
978
|
|||||
308
|
978
|
608
|
966
|
908
|
943
|
1208
|
968
|
1508
|
961
|
1808
|
954
|
|||||
309
|
946
|
609
|
953
|
909
|
966
|
1209
|
939
|
1509
|
948
|
1809
|
956
|
|||||
310
|
981
|
610
|
953
|
910
|
997
|
1210
|
960
|
1510
|
975
|
1810
|
969
|
|||||
311
|
945
|
611
|
977
|
911
|
916
|
1211
|
948
|
1511
|
952
|
1811
|
952
|
|||||
312
|
1004
|
612
|
946
|
912
|
981
|
1212
|
966
|
1512
|
974
|
1812
|
970
|
|||||
313
|
945
|
613
|
972
|
913
|
957
|
1213
|
980
|
1513
|
943
|
1813
|
961
|
|||||
314
|
976
|
614
|
934
|
914
|
945
|
1214
|
957
|
1514
|
956
|
1814
|
936
|
|||||
315
|
946
|
615
|
979
|
915
|
951
|
1215
|
954
|
1515
|
968
|
1815
|
975
|
|||||
316
|
965
|
616
|
970
|
916
|
952
|
1216
|
955
|
1516
|
964
|
1816
|
949
|
|||||
317
|
965
|
617
|
928
|
917
|
975
|
1217
|
965
|
1517
|
948
|
1817
|
973
|
|||||
318
|
956
|
618
|
977
|
918
|
987
|
1218
|
955
|
1518
|
975
|
1818
|
963
|
|||||
319
|
959
|
619
|
971
|
919
|
922
|
1219
|
964
|
1519
|
935
|
1819
|
968
|
|||||
320
|
967
|
620
|
953
|
920
|
987
|
1220
|
954
|
1520
|
961
|
1820
|
981
|
|||||
321
|
933
|
621
|
949
|
921
|
941
|
1221
|
956
|
1521
|
961
|
1821
|
946
|
|||||
322
|
960
|
622
|
941
|
922
|
973
|
1222
|
958
|
1522
|
956
|
1822
|
950
|
|||||
323
|
956
|
623
|
959
|
923
|
944
|
1223
|
958
|
1523
|
959
|
1823
|
964
|
|||||
324
|
966
|
624
|
990
|
924
|
959
|
1224
|
958
|
1524
|
989
|
1824
|
942
|
|||||
325
|
994
|
625
|
933
|
925
|
958
|
1225
|
961
|
1525
|
959
|
1825
|
983
|
|||||
326
|
940
|
626
|
988
|
926
|
947
|
1226
|
963
|
1526
|
951
|
1826
|
958
|
|||||
327
|
958
|
627
|
920
|
927
|
962
|
1227
|
961
|
1527
|
964
|
1827
|
937
|
|||||
328
|
964
|
628
|
998
|
928
|
970
|
1228
|
944
|
1528
|
944
|
1828
|
975
|
|||||
329
|
945
|
629
|
978
|
929
|
964
|
1229
|
972
|
1529
|
964
|
1829
|
942
|
|||||
330
|
972
|
630
|
973
|
930
|
962
|
1230
|
961
|
1530
|
958
|
1830
|
967
|
|||||
331
|
961
|
631
|
940
|
931
|
983
|
1231
|
947
|
1531
|
958
|
1831
|
962
|
|||||
332
|
957
|
632
|
956
|
932
|
934
|
1232
|
968
|
1532
|
945
|
1832
|
971
|
|||||
333
|
972
|
633
|
946
|
933
|
968
|
1233
|
954
|
1533
|
961
|
1833
|
952
|
|||||
334
|
955
|
634
|
977
|
934
|
959
|
1234
|
973
|
1534
|
955
|
1834
|
967
|
|||||
335
|
957
|
635
|
964
|
935
|
949
|
1235
|
934
|
1535
|
956
|
1835
|
943
|
|||||
336
|
951
|
636
|
966
|
936
|
969
|
1236
|
973
|
1536
|
981
|
1836
|
954
|
|||||
337
|
950
|
637
|
964
|
937
|
961
|
1237
|
975
|
1537
|
967
|
1837
|
967
|
|||||
338
|
979
|
638
|
949
|
938
|
968
|
1238
|
932
|
1538
|
954
|
1838
|
967
|
|||||
339
|
961
|
639
|
959
|
939
|
968
|
1239
|
965
|
1539
|
939
|
1839
|
971
|
|||||
340
|
966
|
640
|
960
|
940
|
932
|
1240
|
960
|
1540
|
979
|
1840
|
944
|
|||||
341
|
959
|
641
|
970
|
941
|
970
|
1241
|
950
|
1541
|
955
|
1841
|
970
|
|||||
342
|
952
|
642
|
965
|
942
|
963
|
1242
|
957
|
1542
|
964
|
1842
|
948
|
|||||
343
|
968
|
643
|
965
|
943
|
918
|
1243
|
957
|
1543
|
953
|
1843
|
991
|
|||||
344
|
969
|
644
|
950
|
944
|
997
|
1244
|
952
|
1544
|
980
|
1844
|
948
|
|||||
345
|
949
|
645
|
953
|
945
|
927
|
1245
|
964
|
1545
|
944
|
1845
|
1054
|
|||||
346
|
967
|
646
|
967
|
946
|
926
|
1246
|
957
|
1546
|
951
|
1846
|
875
|
|||||
347
|
938
|
647
|
984
|
947
|
1049
|
1247
|
970
|
1547
|
967
|
1847
|
1013
|
|||||
348
|
987
|
648
|
941
|
948
|
871
|
1248
|
977
|
1548
|
960
|
1848
|
892
|
|||||
349
|
955
|
649
|
941
|
949
|
1085
|
1249
|
949
|
1549
|
950
|
1849
|
981
|
|||||
350
|
986
|
650
|
967
|
950
|
890
|
1250
|
958
|
1550
|
981
|
1850
|
957
|
|||||
351
|
937
|
651
|
957
|
951
|
997
|
1251
|
941
|
1551
|
945
|
1851
|
969
|
|||||
352
|
1017
|
652
|
956
|
952
|
957
|
1252
|
962
|
1552
|
958
|
1852
|
968
|
|||||
353
|
927
|
653
|
958
|
953
|
946
|
1253
|
965
|
1553
|
953
|
1853
|
961
|
|||||
354
|
955
|
654
|
972
|
954
|
952
|
1254
|
953
|
1554
|
963
|
1854
|
933
|
|||||
355
|
949
|
655
|
956
|
955
|
976
|
1255
|
961
|
1555
|
964
|
1855
|
1001
|
|||||
356
|
953
|
656
|
958
|
956
|
936
|
1256
|
956
|
1556
|
966
|
1856
|
925
|
|||||
357
|
958
|
657
|
961
|
957
|
984
|
1257
|
955
|
1557
|
966
|
1857
|
971
|
|||||
358
|
968
|
658
|
950
|
958
|
930
|
1258
|
963
|
1558
|
948
|
1858
|
995
|
|||||
359
|
957
|
659
|
960
|
959
|
978
|
1259
|
956
|
1559
|
983
|
1859
|
923
|
|||||
360
|
953
|
660
|
961
|
960
|
977
|
1260
|
963
|
1560
|
929
|
1860
|
971
|
|||||
361
|
953
|
661
|
965
|
961
|
947
|
1261
|
964
|
1561
|
962
|
1861
|
937
|
|||||
362
|
965
|
662
|
956
|
962
|
966
|
1262
|
971
|
1562
|
951
|
1862
|
963
|
|||||
363
|
959
|
663
|
947
|
963
|
956
|
1263
|
934
|
1563
|
974
|
1863
|
963
|
|||||
364
|
961
|
664
|
974
|
964
|
966
|
1264
|
983
|
1564
|
938
|
1864
|
958
|
|||||
365
|
963
|
665
|
948
|
965
|
966
|
1265
|
956
|
1565
|
965
|
1865
|
963
|
|||||
366
|
964
|
666
|
970
|
966
|
951
|
1266
|
946
|
1566
|
950
|
1866
|
966
|
|||||
367
|
957
|
667
|
963
|
967
|
946
|
1267
|
968
|
1567
|
963
|
1867
|
938
|
|||||
368
|
953
|
668
|
952
|
968
|
965
|
1268
|
939
|
1568
|
961
|
1868
|
967
|
|||||
369
|
951
|
669
|
961
|
969
|
952
|
1269
|
977
|
1569
|
965
|
1869
|
965
|
|||||
370
|
974
|
670
|
973
|
970
|
986
|
1270
|
953
|
1570
|
948
|
1870
|
956
|
|||||
371
|
947
|
671
|
936
|
971
|
955
|
1271
|
965
|
1571
|
969
|
1871
|
959
|
|||||
372
|
950
|
672
|
981
|
972
|
965
|
1272
|
964
|
1572
|
949
|
1872
|
960
|
|||||
373
|
955
|
673
|
967
|
973
|
960
|
1273
|
965
|
1573
|
959
|
1873
|
967
|
|||||
374
|
983
|
674
|
944
|
974
|
962
|
1274
|
958
|
1574
|
974
|
1874
|
941
|
|||||
375
|
937
|
675
|
960
|
975
|
932
|
1275
|
958
|
1575
|
971
|
1875
|
961
|
|||||
376
|
898
|
676
|
965
|
976
|
990
|
1276
|
948
|
1576
|
951
|
1876
|
969
|
|||||
377
|
940
|
677
|
958
|
977
|
932
|
1277
|
960
|
1577
|
961
|
1877
|
963
|
|||||
378
|
965
|
678
|
957
|
978
|
989
|
1278
|
967
|
1578
|
968
|
1878
|
950
|
|||||
379
|
966
|
679
|
968
|
979
|
955
|
1279
|
952
|
1579
|
936
|
1879
|
997
|
|||||
380
|
966
|
680
|
948
|
980
|
942
|
1280
|
973
|
1580
|
978
|
1880
|
910
|
|||||
381
|
952
|
681
|
966
|
981
|
961
|
1281
|
952
|
1581
|
946
|
1881
|
1012
|
|||||
382
|
951
|
682
|
957
|
982
|
937
|
1282
|
950
|
1582
|
982
|
1882
|
953
|
|||||
383
|
961
|
683
|
967
|
983
|
985
|
1283
|
943
|
1583
|
959
|
1883
|
917
|
|||||
384
|
975
|
684
|
950
|
984
|
936
|
1284
|
939
|
1584
|
960
|
1884
|
995
|
|||||
385
|
937
|
685
|
960
|
985
|
983
|
1285
|
1023
|
1585
|
954
|
1885
|
949
|
|||||
386
|
961
|
686
|
955
|
986
|
946
|
1286
|
952
|
1586
|
981
|
1886
|
971
|
|||||
387
|
985
|
687
|
958
|
987
|
990
|
1287
|
956
|
1587
|
931
|
1887
|
959
|
|||||
388
|
947
|
688
|
963
|
988
|
936
|
1288
|
951
|
1588
|
974
|
1888
|
957
|
|||||
389
|
962
|
689
|
970
|
989
|
1000
|
1289
|
950
|
1589
|
950
|
1889
|
965
|
|||||
390
|
961
|
690
|
962
|
990
|
947
|
1290
|
946
|
1590
|
948
|
1890
|
953
|
|||||
391
|
977
|
691
|
953
|
991
|
959
|
1291
|
969
|
1591
|
965
|
1891
|
965
|
|||||
392
|
953
|
692
|
954
|
992
|
965
|
1292
|
955
|
1592
|
949
|
1892
|
955
|
|||||
393
|
960
|
693
|
987
|
993
|
945
|
1293
|
980
|
1593
|
968
|
1893
|
974
|
|||||
394
|
957
|
694
|
950
|
994
|
956
|
1294
|
942
|
1594
|
956
|
1894
|
967
|
|||||
395
|
966
|
695
|
947
|
995
|
964
|
1295
|
955
|
1595
|
971
|
1895
|
938
|
|||||
396
|
947
|
696
|
957
|
996
|
953
|
1296
|
955
|
1596
|
954
|
1896
|
969
|
|||||
397
|
978
|
697
|
954
|
997
|
969
|
1297
|
950
|
1597
|
957
|
1897
|
966
|
|||||
398
|
940
|
698
|
950
|
998
|
941
|
1298
|
977
|
1598
|
957
|
1898
|
971
|
|||||
399
|
995
|
699
|
976
|
999
|
949
|
1299
|
956
|
1599
|
956
|
1899
|
967
|
|||||
400
|
945
|
700
|
983
|
1000
|
964
|
1300
|
962
|
1600
|
980
|
1900
|
947
|
|||||
401
|
934
|
701
|
952
|
1001
|
950
|
1301
|
959
|
1601
|
958
|
1901
|
944
|
|||||
402
|
991
|
702
|
948
|
1002
|
967
|
1302
|
943
|
1602
|
959
|
1902
|
957
|
|||||
403
|
948
|
703
|
965
|
1003
|
952
|
1303
|
960
|
1603
|
957
|
1903
|
950
|
|||||
404
|
965
|
704
|
956
|
1004
|
958
|
1304
|
939
|
1604
|
957
|
1904
|
974
|
|||||
405
|
953
|
705
|
964
|
1005
|
965
|
1305
|
992
|
1605
|
972
|
1905
|
957
|
|||||
406
|
983
|
706
|
962
|
1006
|
952
|
1306
|
944
|
1606
|
954
|
1906
|
980
|
|||||
407
|
930
|
707
|
979
|
1007
|
951
|
1307
|
1016
|
1607
|
954
|
1907
|
928
|
|||||
408
|
1022
|
708
|
933
|
1008
|
970
|
1308
|
913
|
1608
|
967
|
1908
|
962
|
|||||
409
|
894
|
709
|
939
|
1009
|
944
|
1309
|
985
|
1609
|
964
|
1909
|
961
|
|||||
410
|
1026
|
710
|
959
|
1010
|
955
|
1310
|
927
|
1610
|
957
|
1910
|
960
|
|||||
411
|
971
|
711
|
974
|
1011
|
968
|
1311
|
991
|
1611
|
947
|
1911
|
976
|
|||||
412
|
932
|
712
|
975
|
1012
|
969
|
1312
|
963
|
1612
|
976
|
1912
|
934
|
|||||
413
|
958
|
713
|
944
|
1013
|
959
|
1313
|
981
|
1613
|
951
|
1913
|
955
|
|||||
414
|
945
|
714
|
967
|
1014
|
961
|
1314
|
926
|
1614
|
963
|
1914
|
979
|
|||||
415
|
954
|
715
|
963
|
1015
|
963
|
1315
|
956
|
1615
|
960
|
1915
|
965
|
|||||
416
|
967
|
716
|
934
|
1016
|
959
|
1316
|
969
|
1616
|
949
|
1916
|
946
|
|||||
417
|
961
|
717
|
958
|
1017
|
956
|
1317
|
942
|
1617
|
949
|
1917
|
955
|
|||||
418
|
963
|
718
|
969
|
1018
|
971
|
1318
|
970
|
1618
|
956
|
1918
|
978
|
|||||
419
|
970
|
719
|
967
|
1019
|
955
|
1319
|
958
|
1619
|
954
|
1919
|
1008
|
|||||
420
|
946
|
720
|
951
|
1020
|
940
|
1320
|
989
|
1620
|
985
|
1920
|
919
|
|||||
421
|
951
|
721
|
967
|
1021
|
976
|
1321
|
942
|
1621
|
917
|
1921
|
958
|
|||||
422
|
946
|
722
|
961
|
1022
|
961
|
1322
|
978
|
1622
|
978
|
1922
|
964
|
|||||
423
|
985
|
723
|
959
|
1023
|
981
|
1323
|
947
|
1623
|
950
|
1923
|
939
|
|||||
424
|
967
|
724
|
965
|
1024
|
945
|
1324
|
968
|
1624
|
977
|
1924
|
978
|
|||||
425
|
937
|
725
|
951
|
1025
|
989
|
1325
|
949
|
1625
|
969
|
1925
|
959
|
|||||
426
|
968
|
726
|
965
|
1026
|
915
|
1326
|
959
|
1626
|
940
|
1926
|
962
|
|||||
427
|
958
|
727
|
965
|
1027
|
996
|
1327
|
952
|
1627
|
965
|
1927
|
949
|
|||||
428
|
963
|
728
|
965
|
1028
|
937
|
1328
|
972
|
1628
|
970
|
1928
|
961
|
|||||
429
|
963
|
729
|
952
|
1029
|
961
|
1329
|
944
|
1629
|
963
|
1929
|
950
|
|||||
430
|
944
|
730
|
960
|
1030
|
967
|
1330
|
955
|
1630
|
953
|
1930
|
993
|
|||||
431
|
977
|
731
|
947
|
1031
|
953
|
1331
|
966
|
1631
|
958
|
1931
|
957
|
|||||
432
|
963
|
732
|
961
|
1032
|
942
|
1332
|
958
|
1632
|
965
|
1932
|
967
|
|||||
433
|
949
|
733
|
962
|
1033
|
950
|
1333
|
971
|
1633
|
957
|
1933
|
957
|
|||||
434
|
951
|
734
|
952
|
1034
|
982
|
1334
|
953
|
1634
|
967
|
1934
|
962
|
|||||
435
|
985
|
735
|
992
|
1035
|
964
|
1335
|
969
|
1635
|
959
|
1935
|
955
|
|||||
436
|
912
|
736
|
942
|
1036
|
954
|
1336
|
946
|
1636
|
965
|
1936
|
960
|
|||||
437
|
1055
|
737
|
952
|
1037
|
938
|
1337
|
964
|
1637
|
941
|
1937
|
968
|
|||||
438
|
874
|
738
|
960
|
1038
|
976
|
1338
|
952
|
1638
|
963
|
1938
|
960
|
|||||
439
|
990
|
739
|
962
|
1039
|
960
|
1339
|
970
|
1639
|
964
|
1939
|
933
|
|||||
440
|
959
|
740
|
973
|
1040
|
948
|
1340
|
958
|
1640
|
961
|
1940
|
978
|
|||||
441
|
936
|
741
|
950
|
1041
|
964
|
1341
|
950
|
1641
|
965
|
1941
|
956
|
|||||
442
|
952
|
742
|
957
|
1042
|
969
|
1342
|
943
|
1642
|
962
|
1942
|
962
|
|||||
443
|
956
|
743
|
984
|
1043
|
969
|
1343
|
978
|
1643
|
975
|
1943
|
1000
|
|||||
444
|
956
|
744
|
941
|
1044
|
947
|
1344
|
941
|
1644
|
958
|
1944
|
932
|
|||||
445
|
995
|
745
|
956
|
1045
|
953
|
1345
|
1044
|
1645
|
945
|
1945
|
970
|
|||||
446
|
866
|
746
|
968
|
1046
|
956
|
1346
|
923
|
1646
|
961
|
1946
|
952
|
|||||
447
|
1029
|
747
|
969
|
1047
|
963
|
1347
|
984
|
1647
|
959
|
1947
|
943
|
|||||
448
|
974
|
748
|
951
|
1048
|
959
|
1348
|
956
|
1648
|
961
|
1948
|
982
|
|||||
449
|
979
|
749
|
942
|
1049
|
959
|
1349
|
936
|
1649
|
967
|
1949
|
939
|
|||||
450
|
996
|
750
|
965
|
1050
|
978
|
1350
|
963
|
1650
|
957
|
1950
|
990
|
|||||
451
|
929
|
751
|
955
|
1051
|
946
|
1351
|
952
|
1651
|
972
|
1951
|
957
|
|||||
452
|
982
|
752
|
965
|
1052
|
956
|
1352
|
962
|
1652
|
957
|
1952
|
949
|
|||||
453
|
956
|
753
|
972
|
1053
|
951
|
1353
|
954
|
1653
|
953
|
1953
|
977
|
|||||
454
|
932
|
754
|
950
|
1054
|
958
|
1354
|
958
|
1654
|
959
|
1954
|
923
|
|||||
455
|
987
|
755
|
954
|
1055
|
960
|
1355
|
955
|
1655
|
958
|
1955
|
960
|
|||||
456
|
933
|
756
|
974
|
1056
|
969
|
1356
|
985
|
1656
|
955
|
1956
|
995
|
|||||
457
|
970
|
757
|
953
|
1057
|
971
|
1357
|
930
|
1657
|
966
|
1957
|
928
|
|||||
458
|
964
|
758
|
957
|
1058
|
944
|
1358
|
993
|
1658
|
949
|
1958
|
998
|
|||||
459
|
937
|
759
|
967
|
1059
|
954
|
1359
|
934
|
1659
|
977
|
1959
|
947
|
|||||
460
|
963
|
760
|
958
|
1060
|
952
|
1360
|
972
|
1660
|
949
|
1960
|
973
|
|||||
461
|
968
|
761
|
971
|
1061
|
977
|
1361
|
944
|
1661
|
956
|
1961
|
953
|
|||||
462
|
957
|
762
|
943
|
1062
|
944
|
1362
|
955
|
1662
|
959
|
1962
|
949
|
|||||
463
|
964
|
763
|
953
|
1063
|
953
|
1363
|
967
|
1663
|
986
|
1963
|
961
|
|||||
464
|
967
|
764
|
956
|
1064
|
970
|
1364
|
964
|
1664
|
967
|
1964
|
965
|
|||||
465
|
954
|
765
|
961
|
1065
|
956
|
1365
|
955
|
1665
|
937
|
1965
|
958
|
|||||
466
|
962
|
766
|
969
|
1066
|
951
|
1366
|
965
|
1666
|
981
|
1966
|
960
|
|||||
467
|
947
|
767
|
950
|
1067
|
972
|
1367
|
958
|
1667
|
932
|
1967
|
961
|
|||||
468
|
960
|
768
|
969
|
1068
|
960
|
1368
|
957
|
1668
|
979
|
1968
|
957
|
|||||
469
|
953
|
769
|
946
|
1069
|
959
|
1369
|
976
|
1669
|
958
|
1969
|
982
|
|||||
470
|
960
|
770
|
965
|
1070
|
962
|
1370
|
950
|
1670
|
959
|
1970
|
927
|
|||||
471
|
991
|
771
|
961
|
1071
|
950
|
1371
|
978
|
1671
|
958
|
1971
|
987
|
|||||
472
|
927
|
772
|
948
|
1072
|
976
|
1372
|
945
|
1672
|
955
|
1972
|
956
|
|||||
473
|
946
|
773
|
973
|
1073
|
947
|
1373
|
960
|
1673
|
956
|
1973
|
953
|
|||||
474
|
970
|
774
|
966
|
1074
|
961
|
1374
|
957
|
1674
|
979
|
1974
|
939
|
|||||
475
|
942
|
775
|
948
|
1075
|
967
|
1375
|
961
|
1675
|
944
|
1975
|
969
|
|||||
476
|
983
|
776
|
958
|
1076
|
953
|
1376
|
959
|
1676
|
985
|
1976
|
958
|
|||||
477
|
977
|
777
|
963
|
1077
|
965
|
1377
|
960
|
1677
|
934
|
1977
|
952
|
|||||
478
|
947
|
778
|
986
|
1078
|
962
|
1378
|
957
|
1678
|
966
|
1978
|
959
|
|||||
479
|
973
|
779
|
956
|
1079
|
947
|
1379
|
964
|
1679
|
963
|
1979
|
925
|
|||||
480
|
938
|
780
|
935
|
1080
|
983
|
1380
|
978
|
1680
|
954
|
1980
|
1002
|
|||||
481
|
965
|
781
|
937
|
1081
|
961
|
1381
|
935
|
1681
|
959
|
1981
|
878
|
|||||
482
|
970
|
782
|
977
|
1082
|
948
|
1382
|
963
|
1682
|
949
|
1982
|
1072
|
|||||
483
|
954
|
783
|
959
|
1083
|
979
|
1383
|
971
|
1683
|
977
|
1983
|
899
|
|||||
484
|
952
|
784
|
970
|
1084
|
941
|
1384
|
954
|
1684
|
949
|
1984
|
1045
|
|||||
485
|
969
|
785
|
953
|
1085
|
971
|
1385
|
978
|
1685
|
954
|
1985
|
916
|
|||||
486
|
925
|
786
|
962
|
1086
|
978
|
1386
|
925
|
1686
|
967
|
1986
|
993
|
|||||
487
|
994
|
787
|
976
|
1087
|
933
|
1387
|
978
|
1687
|
965
|
1987
|
927
|
|||||
488
|
925
|
788
|
958
|
1088
|
961
|
1388
|
957
|
1688
|
972
|
1988
|
955
|
|||||
489
|
1000
|
789
|
960
|
1089
|
998
|
1389
|
960
|
1689
|
951
|
1989
|
956
|
|||||
490
|
945
|
790
|
954
|
1090
|
918
|
1390
|
965
|
1690
|
955
|
1990
|
996
|
|||||
491
|
996
|
791
|
965
|
1091
|
967
|
1391
|
957
|
1691
|
970
|
1991
|
930
|
|||||
492
|
937
|
792
|
960
|
1092
|
947
|
1392
|
969
|
1692
|
962
|
1992
|
954
|
|||||
493
|
960
|
793
|
951
|
1093
|
953
|
1393
|
940
|
1693
|
950
|
1993
|
960
|
|||||
494
|
944
|
794
|
947
|
1094
|
981
|
1394
|
951
|
1694
|
967
|
1994
|
968
|
|||||
495
|
969
|
795
|
975
|
1095
|
958
|
1395
|
976
|
1695
|
975
|
1995
|
992
|
|||||
496
|
954
|
796
|
949
|
1096
|
960
|
1396
|
976
|
1696
|
951
|
1996
|
936
|
|||||
497
|
964
|
797
|
962
|
1097
|
954
|
1397
|
934
|
1697
|
956
|
1997
|
991
|
|||||
498
|
942
|
798
|
959
|
1098
|
963
|
1398
|
967
|
1698
|
947
|
1998
|
937
|
|||||
499
|
964
|
799
|
979
|
1099
|
969
|
1399
|
949
|
1699
|
973
|
1999
|
964
|
|||||
500
|
968
|
800
|
980
|
1100
|
944
|
1400
|
958
|
1700
|
963
|
2000
|
941
|
|||||
501
|
967
|
801
|
954
|
1101
|
980
|
1401
|
960
|
1701
|
947
|
2001
|
961
|
|||||
502
|
962
|
802
|
950
|
1102
|
958
|
1402
|
943
|
1702
|
970
|
2002
|
959
|
|||||
503
|
957
|
803
|
965
|
1103
|
957
|
1403
|
981
|
1703
|
966
|
2003
|
960
|
|||||
504
|
958
|
804
|
943
|
1104
|
948
|
1404
|
970
|
1704
|
926
|
2004
|
961
|
|||||
505
|
957
|
805
|
980
|
1105
|
957
|
1405
|
950
|
1705
|
985
|
2005
|
952
|
|||||
506
|
954
|
806
|
938
|
1106
|
967
|
1406
|
959
|
1706
|
962
|
2006
|
951
|
|||||
507
|
956
|
807
|
966
|
1107
|
960
|
1407
|
992
|
1707
|
963
|
2007
|
971
|
|||||
508
|
969
|
808
|
963
|
1108
|
970
|
1408
|
943
|
1708
|
990
|
2008
|
944
|
|||||
509
|
954
|
809
|
974
|
1109
|
941
|
1409
|
966
|
1709
|
936
|
2009
|
966
|
|||||
510
|
958
|
810
|
971
|
1110
|
993
|
1410
|
955
|
1710
|
957
|
2010
|
973
|
|||||
511
|
971
|
811
|
957
|
1111
|
927
|
1411
|
959
|
1711
|
959
|
2011
|
942
|
|||||
512
|
961
|
812
|
972
|
1112
|
980
|
1412
|
989
|
1712
|
946
|
2012
|
969
|
|||||
513
|
960
|
813
|
951
|
1113
|
943
|
1413
|
939
|
1713
|
974
|
2013
|
945
|
|||||
514
|
955
|
814
|
963
|
1114
|
959
|
1414
|
952
|
1714
|
936
|
2014
|
966
|
|||||
515
|
964
|
815
|
940
|
1115
|
968
|
1415
|
943
|
1715
|
993
|
2015
|
964
|
|||||
516
|
954
|
816
|
959
|
1116
|
946
|
1416
|
950
|
1716
|
961
|
2016
|
961
|
|||||
517
|
967
|
817
|
972
|
1117
|
955
|
1417
|
980
|
1717
|
934
|
2017
|
959
|
|||||
518
|
953
|
818
|
975
|
1118
|
962
|
1418
|
932
|
1718
|
980
|
2018
|
981
|
|||||
519
|
971
|
819
|
946
|
1119
|
962
|
1419
|
983
|
1719
|
950
|
2019
|
922
|
|||||
520
|
960
|
820
|
960
|
1120
|
963
|
1420
|
969
|
1720
|
963
|
2020
|
1018
|
|||||
521
|
960
|
821
|
948
|
1121
|
971
|
1421
|
939
|
1721
|
970
|
2021
|
958
|
|||||
522
|
964
|
822
|
974
|
1122
|
945
|
1422
|
976
|
1722
|
937
|
2022
|
993
|
|||||
523
|
951
|
823
|
943
|
1123
|
987
|
1423
|
940
|
1723
|
975
|
2023
|
935
|
|||||
524
|
966
|
824
|
979
|
1124
|
905
|
1424
|
950
|
1724
|
957
|
2024
|
990
|
|||||
525
|
957
|
825
|
951
|
1125
|
960
|
1425
|
990
|
1725
|
951
|
2025
|
932
|
|||||
526
|
936
|
826
|
969
|
1126
|
969
|
1426
|
955
|
1726
|
963
|
2026
|
987
|
|||||
527
|
961
|
827
|
959
|
1127
|
950
|
1427
|
962
|
1727
|
955
|
2027
|
938
|
|||||
528
|
954
|
828
|
965
|
1128
|
1000
|
1428
|
955
|
1728
|
977
|
2028
|
956
|
|||||
529
|
977
|
829
|
941
|
1129
|
943
|
1429
|
952
|
1729
|
951
|
2029
|
969
|
|||||
530
|
961
|
830
|
960
|
1130
|
960
|
1430
|
979
|
1730
|
950
|
2030
|
956
|
|||||
531
|
943
|
831
|
962
|
1131
|
960
|
1431
|
964
|
1731
|
952
|
2031
|
964
|
|||||
532
|
987
|
832
|
970
|
1132
|
966
|
1432
|
944
|
1732
|
964
|
2032
|
969
|
|||||
533
|
952
|
833
|
960
|
1133
|
950
|
1433
|
952
|
1733
|
969
|
2033
|
949
|
|||||
534
|
961
|
834
|
943
|
1134
|
963
|
1434
|
953
|
1734
|
985
|
2034
|
951
|
|||||
535
|
963
|
835
|
979
|
1135
|
980
|
1435
|
976
|
1735
|
938
|
2035
|
951
|
|||||
536
|
957
|
836
|
956
|
1136
|
954
|
1436
|
956
|
1736
|
947
|
2036
|
971
|
|||||
537
|
950
|
837
|
971
|
1137
|
949
|
1437
|
955
|
1737
|
954
|
2037
|
963
|
|||||
538
|
972
|
838
|
939
|
1138
|
977
|
1438
|
955
|
1738
|
958
|
2038
|
964
|
|||||
539
|
943
|
839
|
958
|
1139
|
948
|
1439
|
959
|
1739
|
975
|
2039
|
950
|
|||||
540
|
960
|
840
|
968
|
1140
|
961
|
1440
|
950
|
1740
|
962
|
2040
|
967
|
|||||
541
|
969
|
841
|
967
|
1141
|
968
|
1441
|
1007
|
1741
|
946
|
2041
|
946
|
|||||
542
|
964
|
842
|
974
|
1142
|
939
|
1442
|
897
|
1742
|
967
|
2042
|
968
|
|||||
543
|
940
|
843
|
939
|
1143
|
958
|
1443
|
996
|
1743
|
954
|
2043
|
976
|
|||||
544
|
982
|
844
|
976
|
1144
|
955
|
1444
|
970
|
1744
|
950
|
2044
|
950
|
|||||
545
|
947
|
845
|
950
|
1145
|
959
|
1445
|
907
|
1745
|
977
|
2045
|
961
|
|||||
546
|
953
|
846
|
1003
|
1146
|
972
|
1446
|
1014
|
1746
|
954
|
2046
|
947
|
|||||
547
|
966
|
847
|
913
|
1147
|
971
|
1447
|
889
|
1747
|
972
|
2047
|
967
|
|||||
548
|
950
|
848
|
1010
|
1148
|
956
|
1448
|
1014
|
1748
|
954
|
2048
|
966
|
|||||
549
|
993
|
849
|
927
|
1149
|
962
|
1449
|
958
|
1749
|
971
|
2049
|
954
|
|||||
550
|
935
|
850
|
966
|
1150
|
945
|
1450
|
953
|
1750
|
958
|
2050
|
962
|
|||||
551
|
992
|
851
|
958
|
1151
|
959
|
1451
|
975
|
1751
|
952
|
2051
|
962
|
|||||
552
|
943
|
852
|
967
|
1152
|
954
|
1452
|
951
|
1752
|
962
|
2052
|
970
|
|||||
553
|
960
|
853
|
955
|
1153
|
986
|
1453
|
949
|
1753
|
966
|
2053
|
955
|
|||||
554
|
982
|
854
|
977
|
1154
|
939
|
1454
|
962
|
1754
|
953
|
2054
|
955
|
|||||
555
|
954
|
855
|
935
|
1155
|
966
|
1455
|
957
|
1755
|
979
|
2055
|
959
|
|||||
556
|
941
|
856
|
962
|
1156
|
953
|
1456
|
937
|
1756
|
952
|
2056
|
967
|
|||||
557
|
959
|
857
|
958
|
1157
|
964
|
1457
|
1005
|
1757
|
947
|
2057
|
957
|
|||||
558
|
944
|
858
|
964
|
1158
|
949
|
1458
|
905
|
1758
|
968
|
2058
|
967
|
|||||
559
|
967
|
859
|
955
|
1159
|
966
|
1459
|
1032
|
1759
|
961
|
2059
|
943
|
|||||
560
|
958
|
860
|
957
|
1160
|
956
|
1460
|
912
|
1760
|
954
|
2060
|
978
|
|||||
561
|
964
|
861
|
976
|
1161
|
962
|
1461
|
985
|
1761
|
958
|
2061
|
946
|
|||||
562
|
965
|
862
|
953
|
1162
|
949
|
1462
|
950
|
1762
|
974
|
2062
|
960
|
|||||
563
|
961
|
863
|
953
|
1163
|
968
|
1463
|
966
|
1763
|
957
|
2063
|
967
|
|||||
564
|
951
|
864
|
962
|
1164
|
961
|
1464
|
960
|
1764
|
962
|
2064
|
949
|
|||||
565
|
960
|
865
|
963
|
1165
|
949
|
1465
|
970
|
1765
|
951
|
2065
|
965
|
|||||
566
|
967
|
866
|
966
|
1166
|
987
|
1466
|
941
|
1766
|
975
|
2066
|
950
|
|||||
567
|
953
|
867
|
950
|
1167
|
939
|
1467
|
964
|
1767
|
949
|
2067
|
966
|
|||||
568
|
969
|
868
|
959
|
1168
|
987
|
1468
|
947
|
1768
|
962
|
2068
|
959
|
|||||
569
|
955
|
869
|
964
|
1169
|
942
|
1469
|
954
|
1769
|
951
|
2069
|
972
|
|||||
570
|
966
|
870
|
957
|
1170
|
973
|
1470
|
988
|
1770
|
958
|
2070
|
941
|
|||||
571
|
956
|
871
|
972
|
1171
|
957
|
1471
|
931
|
1771
|
962
|
2071
|
948
|
|||||
572
|
953
|
872
|
945
|
1172
|
946
|
1472
|
989
|
1772
|
964
|
2072
|
972
|
|||||
573
|
956
|
873
|
972
|
1173
|
974
|
1473
|
935
|
1773
|
960
|
2073
|
944
|
|||||
574
|
972
|
874
|
950
|
1174
|
954
|
1474
|
968
|
1774
|
956
|
2074
|
962
|
|||||
575
|
950
|
875
|
953
|
1175
|
962
|
1475
|
961
|
1775
|
981
|
2075
|
971
|
|||||
576
|
971
|
876
|
952
|
1176
|
957
|
1476
|
962
|
1776
|
939
|
2076
|
964
|
|||||
577
|
981
|
877
|
944
|
1177
|
957
|
1477
|
938
|
1777
|
964
|
2077
|
952
|
|||||
578
|
935
|
878
|
982
|
1178
|
962
|
1478
|
969
|
1778
|
955
|
2078
|
948
|
|||||
579
|
971
|
879
|
964
|
1179
|
954
|
1479
|
902
|
1779
|
976
|
2079
|
954
|
|||||
580
|
945
|
880
|
955
|
1180
|
965
|
1480
|
999
|
1780
|
960
|
2080
|
1002
|
|||||
581
|
968
|
881
|
952
|
1181
|
938
|
1481
|
916
|
1781
|
957
|
2081
|
938
|
|||||
582
|
929
|
882
|
968
|
1182
|
978
|
1482
|
997
|
1782
|
957
|
2082
|
1004
|
|||||
583
|
988
|
883
|
951
|
1183
|
941
|
1483
|
980
|
1783
|
962
|
2083
|
923
|
|||||
584
|
956
|
884
|
973
|
1184
|
973
|
1484
|
974
|
1784
|
951
|
2084
|
983
|
|||||
585
|
971
|
885
|
959
|
1185
|
965
|
1485
|
937
|
1785
|
961
|
2085
|
929
|
|||||
586
|
938
|
886
|
970
|
1186
|
959
|
1486
|
980
|
1786
|
951
|
2086
|
987
|
|||||
587
|
1070
|
887
|
938
|
1187
|
976
|
1487
|
952
|
1787
|
974
|
2087
|
940
|
|||||
588
|
864
|
888
|
971
|
1188
|
945
|
1488
|
969
|
1788
|
958
|
2088
|
966
|
|||||
589
|
1037
|
889
|
956
|
1189
|
954
|
1489
|
961
|
1789
|
950
|
2089
|
962
|
|||||
590
|
905
|
890
|
959
|
1190
|
951
|
1490
|
949
|
1790
|
963
|
2090
|
952
|
|||||
591
|
954
|
891
|
961
|
1191
|
955
|
1491
|
966
|
1791
|
974
|
2091
|
963
|
|||||
592
|
961
|
892
|
964
|
1192
|
962
|
1492
|
982
|
1792
|
959
|
2092
|
941
|
|||||
593
|
939
|
893
|
964
|
1193
|
954
|
1493
|
950
|
1793
|
961
|
2093
|
955
|
|||||
594
|
971
|
894
|
943
|
1194
|
960
|
1494
|
951
|
1794
|
949
|
2094
|
974
|
|||||
595
|
978
|
895
|
953
|
1195
|
958
|
1495
|
967
|
1795
|
956
|
2095
|
972
|
|||||
596
|
968
|
896
|
951
|
1196
|
969
|
1496
|
959
|
1796
|
959
|
2096
|
943
|
|||||
597
|
953
|
897
|
1007
|
1197
|
940
|
1497
|
981
|
1797
|
959
|
2097
|
965
|
|||||
598
|
949
|
898
|
948
|
1198
|
957
|
1498
|
932
|
1798
|
948
|
2098
|
958
|
|||||
599
|
949
|
899
|
939
|
1199
|
962
|
1499
|
972
|
1799
|
970
|
2099
|
970
|
|||||
2100
|
980
|
|||||||||||||||